Underthestars,
Yes its been a great run and has more to go imo..
It's a complexed chart so I do my best to explain it.
Cheers Pete.
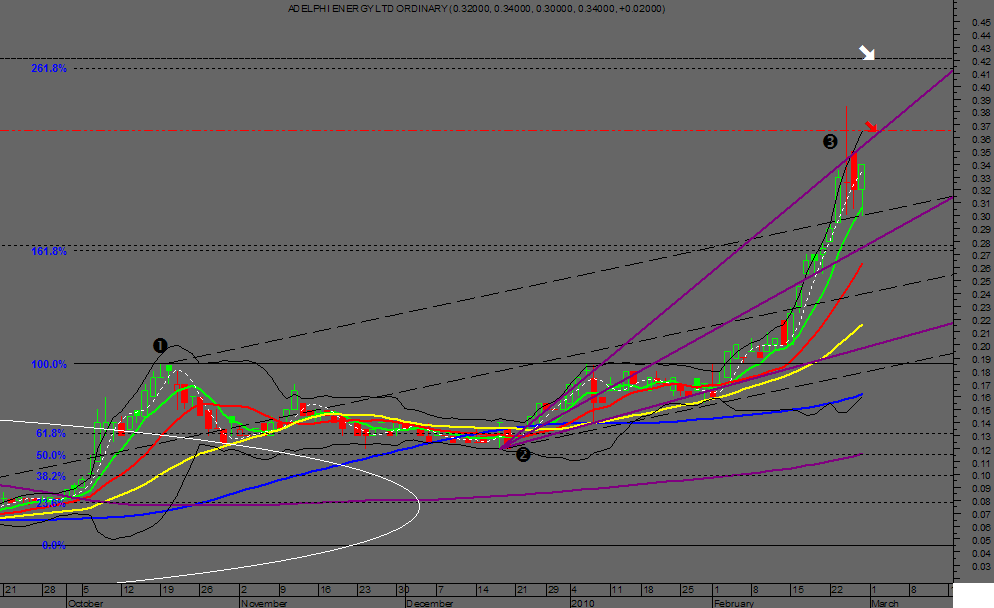
Here's a close up of the daily chart.
Fib projections in Blue next top would be 41/42c ish it may just top at the Red Arrow & Speed & Resitance lines purple.
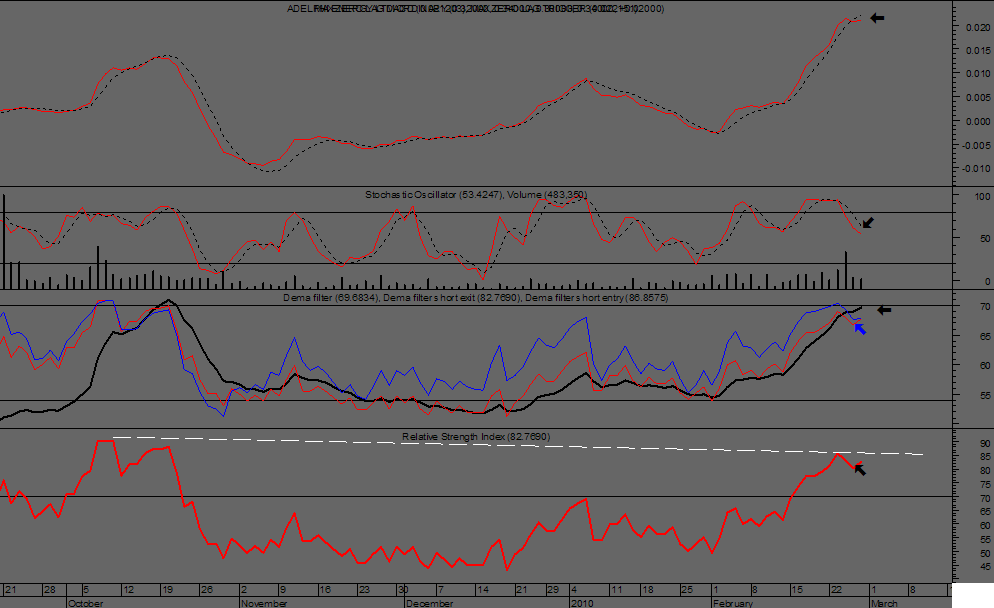
Note the inds very toppy but this mabe S/T imo so needs some sideways but may run up to the Fib 261.8% the Candle is saying that along with the Short Entry Blue Arrow on the Inds.
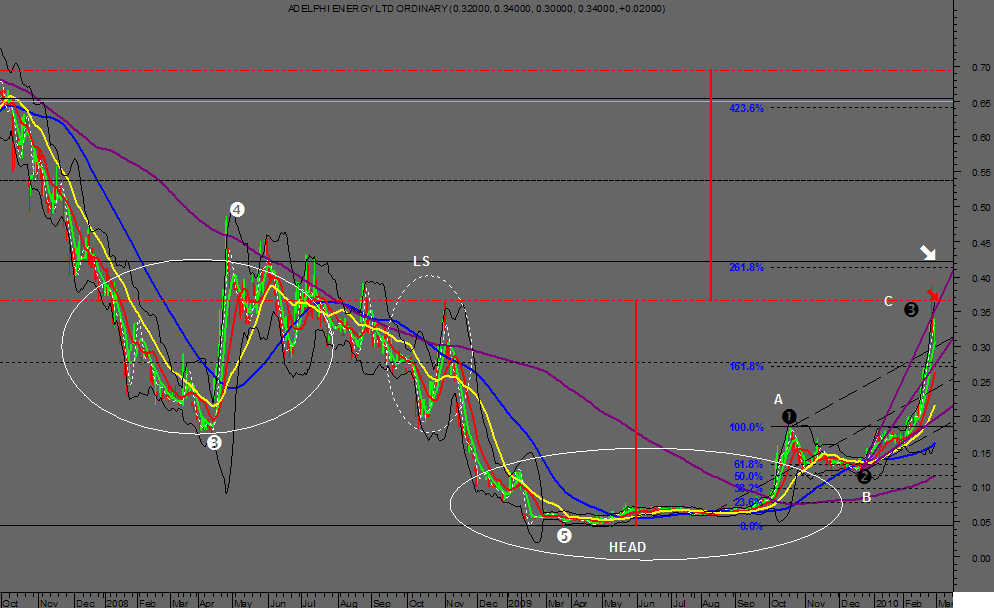
Here's the Daily Chart wider view.
If it was to top at the Red Line and form a Wave 4 this COULD BE a Right Shouler of a Inverse H&S with a target of around 70c issh and close to the 423.6% Fib and Quadrant Line Light Blue.
If it tops at the 261.8% Fib that would give a chance of a Larger Inverted H&S see LS between W3 & W4 IN WHITE TO THE LEFT..this would give a Higher Target.
Its a lot of if's but lets look at the Weekly Chart..
Daily Wide
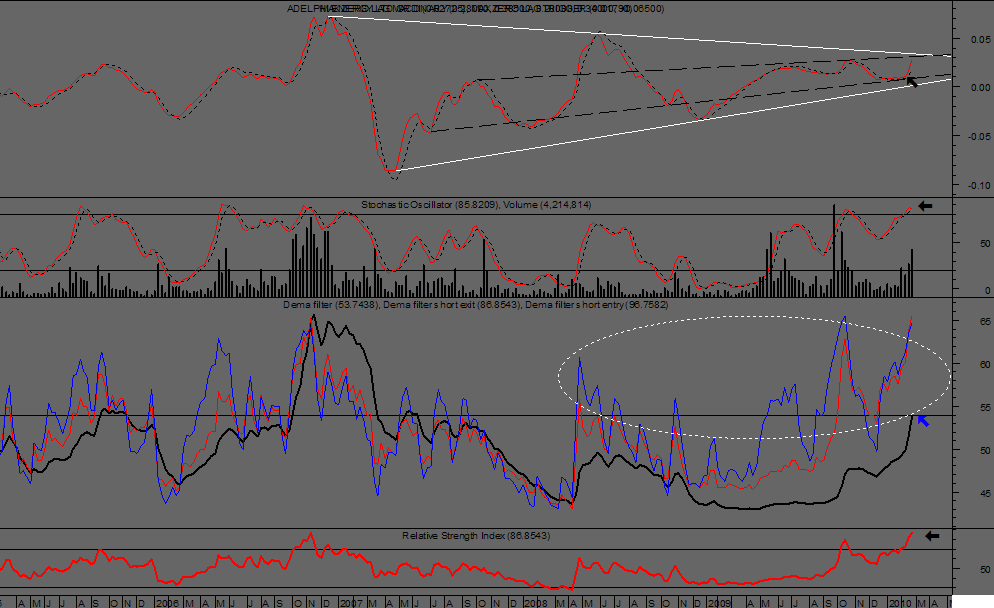
Heres the Weekly.
Note the 200d sma is Resistance Atm Overall Fibs on the left locals on the right the last local isn't far away and will act as Resistance as well.
Hence building the case for a Right Shoulder to form around here some where.?
Note the Inds the Stcoh and RSI are over bought and are saying it must come off a bit of sideways will do it..
The Best bit is the Dema Blue Arrow is only at 54 and has a long way to go.imo
Along with the Macd that has turned up again and is within the White Triangle there is more time before it breaks out of that imo that would give time for the Right shoulder to form...So if the right shoulder forms on the daily it may take about 2/3/4 weeks this could be seen as a Pennant on the weekly chart...
This is all very much IF IF "SO TRADE SAFE."
The thing that makes me think along these lines chart wise is it The Weekly Dema & Macd are pretty much the same set up as EXT before it took off.
So lets what happens from here.
Cheers Pete.
Weekly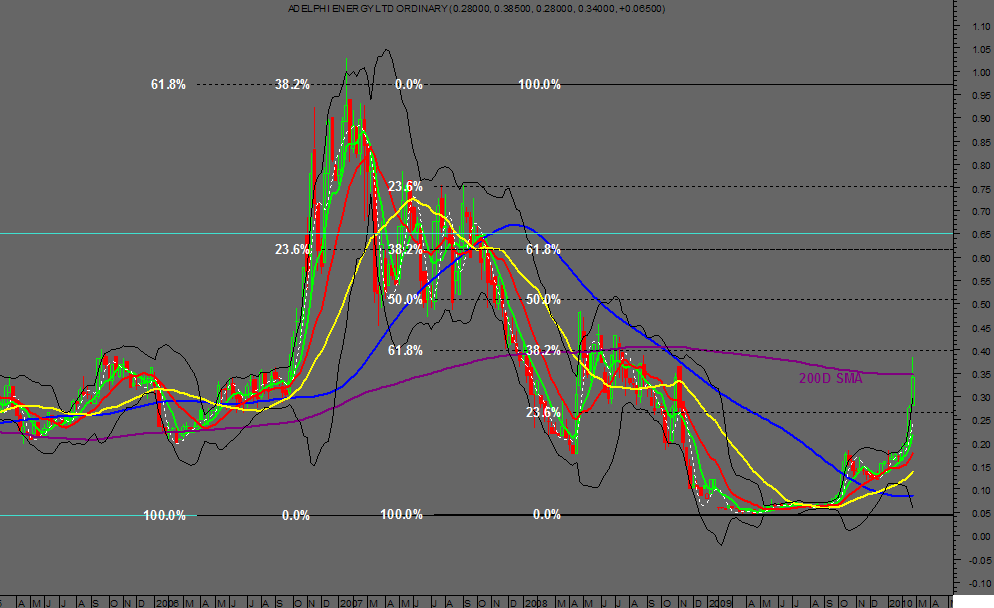
- Forums
- ASX - General
- weekend charting feb 26-8
