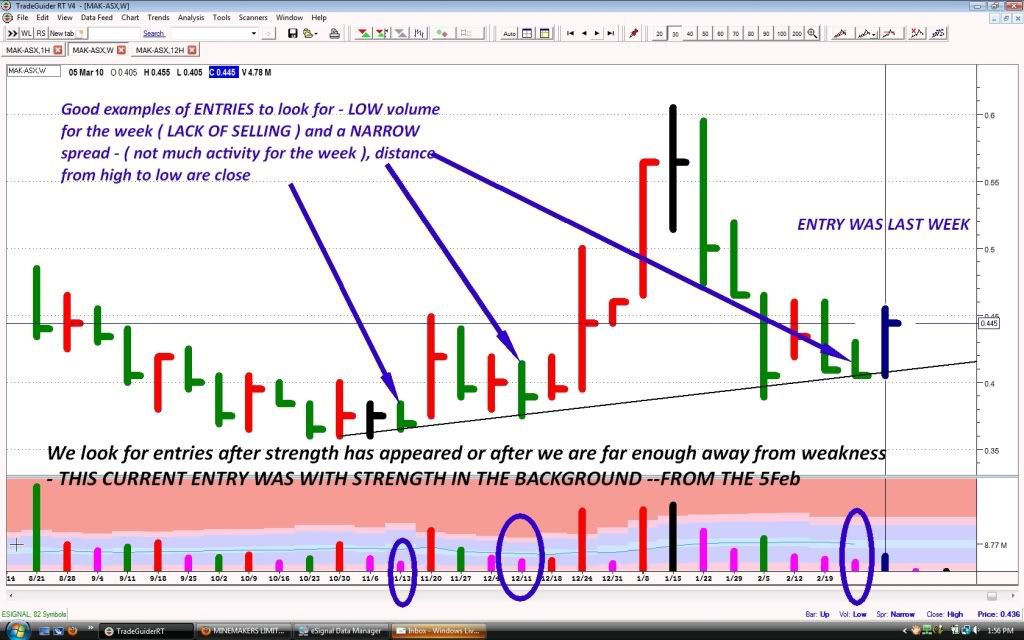
As previously mentioned by woddonnee and myself 2 weeks ago that MAK was getting close to a ST buy here is an updated chart.
Please refer to my previous chart as well, but entry was taken at the close of week 26Feb, because we had strength from buying in the background of early Feb, this can be seen by the high volume that week and it closing off the bottom with the next week up, must have been buying. Entry was taken because of the low volume on the week that ended 26Feb, indicating a lack of selling at about the same price level the strength was several weeks earlier.
This current week has responded upwards Okay but it is only on low volume, not the best one would like and we are getting close to previous resistance. To highlight this I will post a daily chart as well. lol all holders
P.S. this is a weekly chart

- Forums
- ASX - By Stock
- AEV
- mak and grain charts if interested
AEV
avenira limited
Add to My Watchlist
6.25%
 !
0.9¢
mak and grain charts if interested, page-56
Featured News
Add to My Watchlist
What is My Watchlist?
A personalised tool to help users track selected stocks. Delivering real-time notifications on price updates, announcements, and performance stats on each to help make informed investment decisions.
 (20min delay) (20min delay)
|
|||||
|
Last
0.9¢ |
Change
0.001(6.25%) |
Mkt cap ! $27.00M | |||
| Open | High | Low | Value | Volume |
| 0.8¢ | 0.9¢ | 0.8¢ | $7.007K | 874.6K |
Buyers (Bids)
| No. | Vol. | Price($) |
|---|---|---|
| 12 | 6436717 | 0.8¢ |
Sellers (Offers)
| Price($) | Vol. | No. |
|---|---|---|
| 0.9¢ | 4721919 | 11 |
View Market Depth
| No. | Vol. | Price($) |
|---|---|---|
| 12 | 6436717 | 0.008 |
| 5 | 3692490 | 0.007 |
| 6 | 2540000 | 0.006 |
| 2 | 500000 | 0.005 |
| 1 | 1250000 | 0.004 |
| Price($) | Vol. | No. |
|---|---|---|
| 0.009 | 4721919 | 11 |
| 0.010 | 8512531 | 13 |
| 0.011 | 1000000 | 1 |
| 0.012 | 2544954 | 2 |
| 0.013 | 58333 | 1 |
| Last trade - 14.29pm 23/07/2025 (20 minute delay) ? |
Featured News
| AEV (ASX) Chart |


