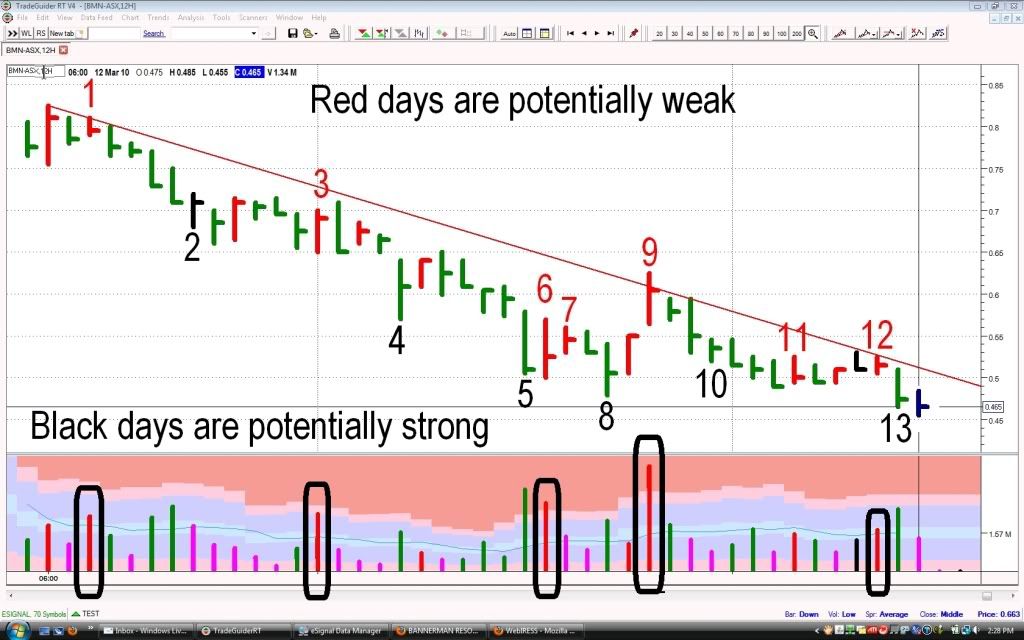
In the ST a change may be close -
No.1 very weak day, it is very narrow Up day on big volume, a sign of offloading
No2. showing strength, finishing high with large volume down bars from potentially buying on the two days prior, but it failed with no intention from the big money to move it on
No3. very weak day, a high volume UP day containing hidden selling and then followed two days later by a perfect setup to go down is a very low volume UP day indicating no intention to take it up
No4. a potential sign of strength from buying, this day finishing off the lows on high volume but then followed by no intention to keep it going.
No5. same as No4 but finishing low
No6. a very weak day, a very high volume UP day, a lot of offloading is happening the close of the day was not high - this was a positive announcement from the company - catching the unwary into buying - while the big money is selling to them with intentions to take it down still
No7. this is the same as No2 day, a very weak day still offloading
No8. same as No4. followed by a bullish day finishing on the highs
No9. a bad day on really big volume catching all the breakout traders closing off the highs and then trapping them in with the intention to take it lower
No10. A positive day - this is an example of what to look for to go long - but it has to have strength behind it not big bad weakness No9.
No11. weak day increase in volume but closing low
No12. same as No1 and No7 but this time on less volume, hmmm could be something in that
No13. this was Thursday - it broke the camels back so to speak, this is potentially a STRONG day from the amount of buying from the big money and then followed by Friday's bar which shows a lack of further selling at this point.
imho I think in the ST we may be in for a bounce - I will enter this trade ONLY on the break of Friday's high - thus not getting caught with price still falling. The ONLY other area that I was going to enter recently was after NO8. but it was followed almost immediately by that very nasty No9. We will soon see next week how it pans out but what we really need now is obviously the direction to change or for some low volume down days finishing middle or high like No10. lol all holders, I think a change is in the air, if not this post will self destruct :) p.s. if my ramblings have confused anyone I will gladly explain them

- Forums
- ASX - By Stock
- BMN
- chart
chart, page-2
-
- There are more pages in this discussion • 188 more messages in this thread...
You’re viewing a single post only. To view the entire thread just sign in or Join Now (FREE)
Featured News
Add BMN (ASX) to my watchlist
 (20min delay) (20min delay)
|
|||||
|
Last
$2.27 |
Change
-0.120(5.02%) |
Mkt cap ! $405.4M | |||
| Open | High | Low | Value | Volume |
| $2.41 | $2.44 | $2.23 | $820.9K | 356.5K |
Buyers (Bids)
| No. | Vol. | Price($) |
|---|---|---|
| 5 | 10039 | $2.26 |
Sellers (Offers)
| Price($) | Vol. | No. |
|---|---|---|
| $2.27 | 2203 | 2 |
View Market Depth
| No. | Vol. | Price($) |
|---|---|---|
| 1 | 6784 | 2.260 |
| 2 | 11111 | 2.250 |
| 1 | 450 | 2.220 |
| 1 | 750 | 2.210 |
| 2 | 6500 | 2.200 |
| Price($) | Vol. | No. |
|---|---|---|
| 2.330 | 2444 | 1 |
| 2.350 | 2136 | 1 |
| 2.440 | 20843 | 4 |
| 2.460 | 23217 | 2 |
| 2.470 | 30000 | 1 |
| Last trade - 16.10pm 13/09/2024 (20 minute delay) ? |
Featured News
| BMN (ASX) Chart |
The Watchlist
LPM
LITHIUM PLUS MINERALS LTD.
Simon Kidston, Non--Executive Director
Simon Kidston
Non--Executive Director
SPONSORED BY The Market Online


