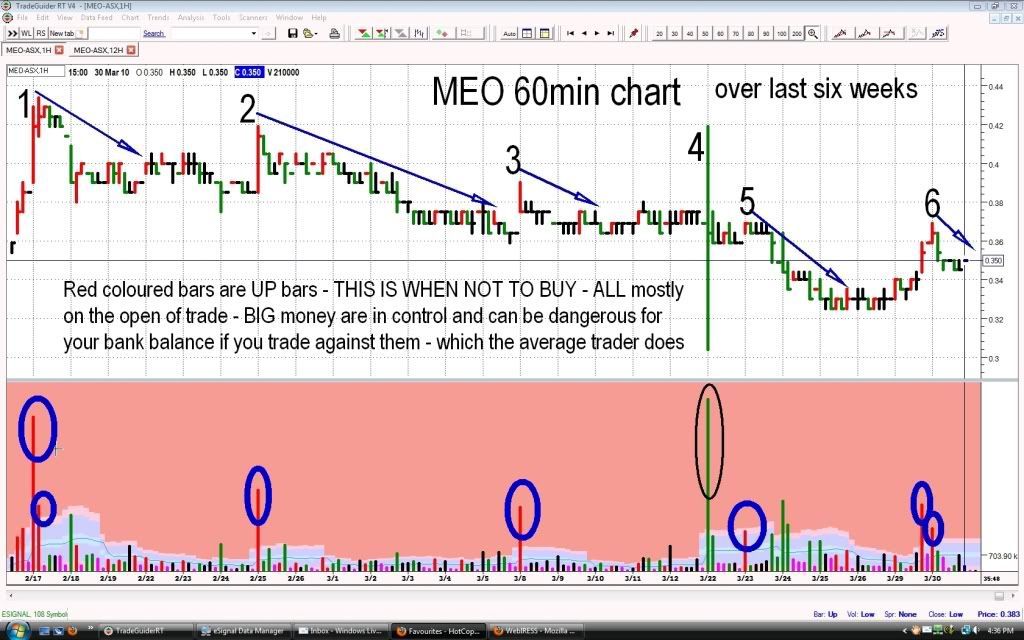
All LT holders please look away. This is a 60min chart which illustrates why on a lot of occasions it is unwise to buy on the open and also on breakouts.
The RED coloured volume and price bars are simply UP bars closing higher than the previous - THIS is when the BIG boys down their selling - to the average trader.
If you look at the volume area, simply look at all the big red volume bars and then see what happens afterwards to the SP.
Bar No.4 was when the trading halt lifted and as we all know the SP sank and then shot up, if we panned down even more to 30min bars we would find the same thing - the second 30min bar would be a big red bar - i.e. the big boys are doing the selling. imo to help your bank balance if you don't already do it, if considering a buy, just avoid these times of selling and buy when the big boys do. lol
- Forums
- ASX - By Stock
- MEO
- chart - don't get caught with your pants down
chart - don't get caught with your pants down
-
- There are more pages in this discussion • 53 more messages in this thread...
You’re viewing a single post only. To view the entire thread just sign in or Join Now (FREE)
Featured News
Add MEO (ASX) to my watchlist
Currently unlisted public company.
The Watchlist
FHE
FRONTIER ENERGY LIMITED
Adam Kiley, CEO
Adam Kiley
CEO
SPONSORED BY The Market Online


