Hi all,
I'm starting my weekend charting here with some Dow Jones charts.
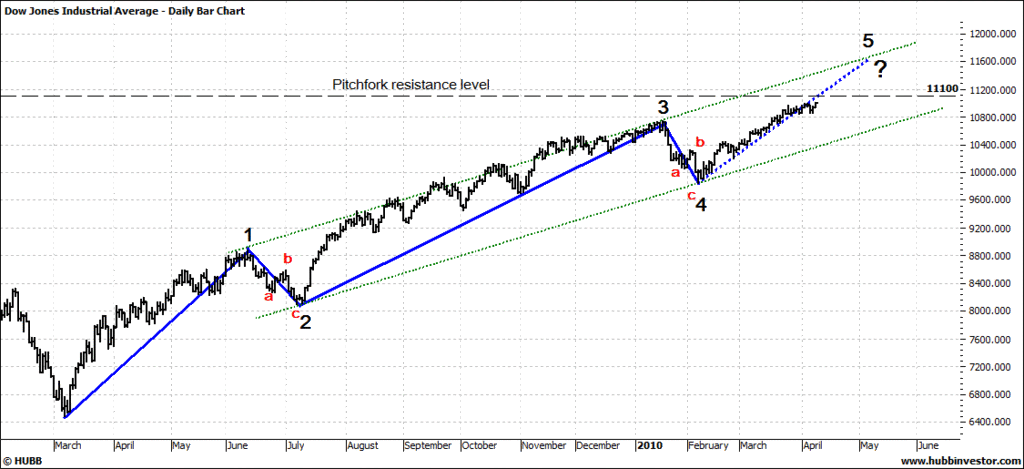
The first one shows the Dow using Elliot Waves. If you believe in EW theory (I don't think I do, but will give it a chance) then this is wave 5 and the last UP movement before we get 5 waves down.
Having broken the high of wave 3 is a positive sign for the bulls. Would have been major bear pattern if it didn't.
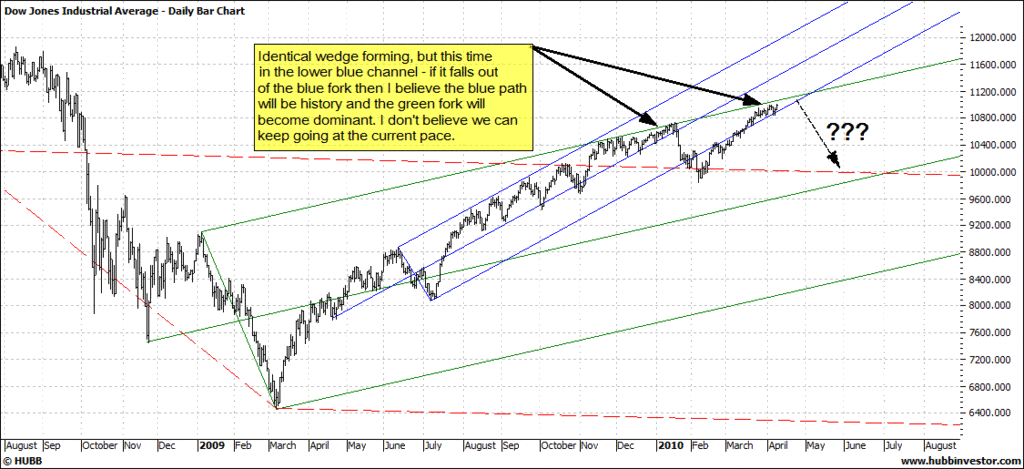
I used a simple parallel channel to pick a top but my pitchfork chart and monthly chart below suggest it won't get there.
The pitchforks suggest there is a little bit of life left before the wedge just like in January.
Pitchforks are about trading what you see, so as long as it's in the blue fork then bullish sentiment should remain.
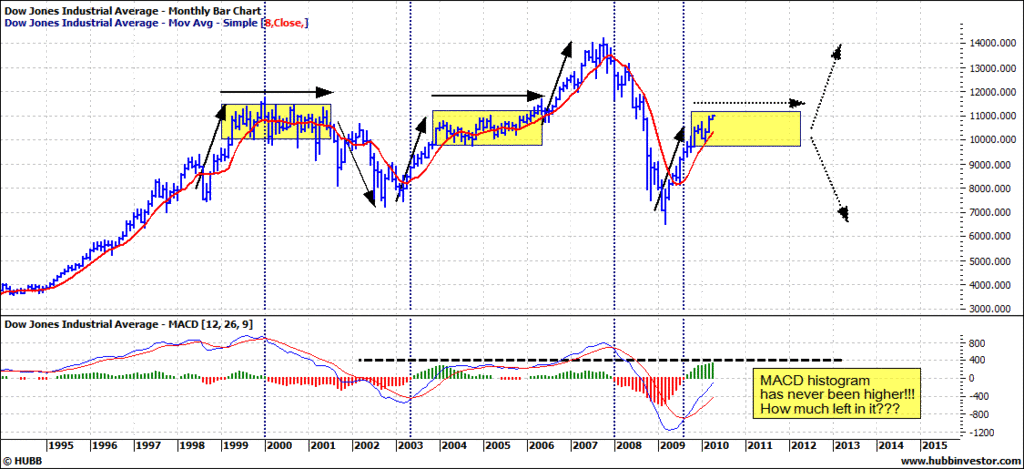
And finally the monthly as a general guide using previous patterns and ranges, both in price and time which would suggest a longer period of activity between 10,000 and 11,000.
All up, the bottom of elliot wave 3, the middle line of the long term red pitchfork, and the monthly range indicate just under 10,000 points as a target for the next correction.
Cheers,
10cents
- Forums
- ASX - General
- weekend charting 9 april
weekend charting 9 april, page-54
Featured News
Featured News
The Watchlist
3DA
AMAERO LTD
Hank Holland, Chairman and CEO
Hank Holland
Chairman and CEO
Previous Video
Next Video
SPONSORED BY The Market Online


