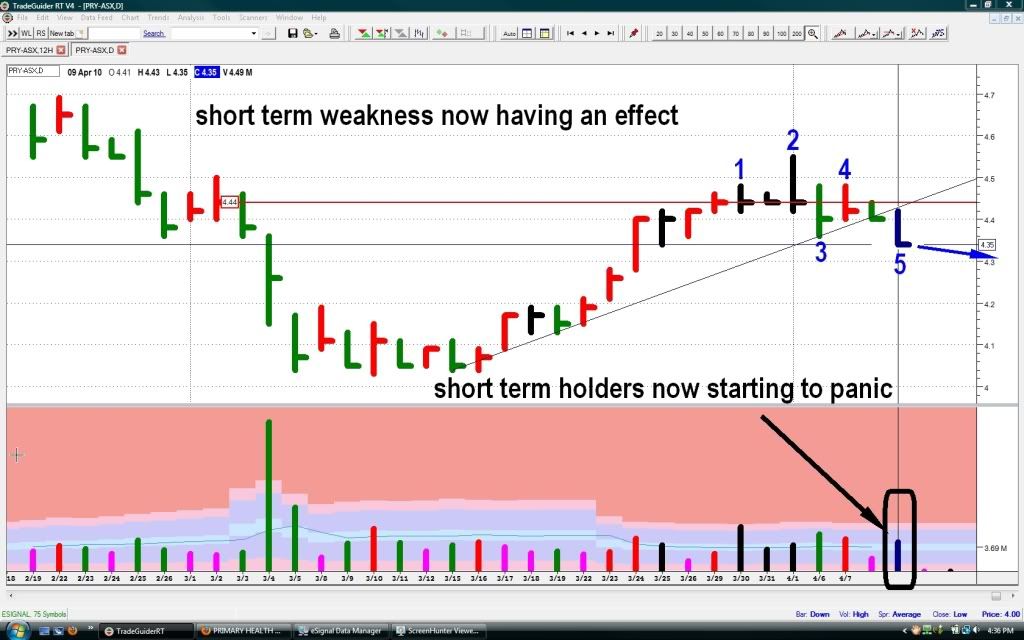
As can be seen on the chart
No1. imo is a form of capping
No2. a trap for traders buying on breakouts etc
No3. the result of the ST profit taking by the big boys
No4. a weak looking day finishing low on average volume - indicating no real intent from the stronger players to take it up, same as the next day, no stronger players are active.
Now Friday No5. imo with the bigger increase in volume is the ST traders who bought maybe on No2 or No4 now selling, maybe.
Unfortunately this weakness is hurting my bank account as well but if one can half see what may be happening it stands you in good stead to take advantage of the next turn which may not be that far away. With the bigger volume on Friday, this may be the start of what the stronger player wish, taking his profits up top and now they are slowly buying them back, it may continue for a little while yet but it will be visible on the chart when they decide enough is enough.

- Forums
- ASX - By Stock
- HLS
- pry - chart
pry - chart, page-28
-
- There are more pages in this discussion • 1 more message in this thread...
You’re viewing a single post only. To view the entire thread just sign in or Join Now (FREE)
Featured News
Add HLS (ASX) to my watchlist
 (20min delay) (20min delay)
|
|||||
|
Last
$1.59 |
Change
0.000(0.00%) |
Mkt cap ! $1.150B | |||
| Open | High | Low | Value | Volume |
| 0.0¢ | 0.0¢ | 0.0¢ | $0 | 0 |
Buyers (Bids)
| No. | Vol. | Price($) |
|---|---|---|
| 1 | 4350 | $1.59 |
Sellers (Offers)
| Price($) | Vol. | No. |
|---|---|---|
| $1.54 | 693 | 5 |
View Market Depth
| No. | Vol. | Price($) |
|---|---|---|
| 1 | 2786 | 1.560 |
| 1 | 3271 | 1.545 |
| 1 | 10000 | 1.540 |
| 2 | 6651 | 1.530 |
| 2 | 8000 | 1.525 |
| Price($) | Vol. | No. |
|---|---|---|
| 1.590 | 5160 | 2 |
| 1.600 | 15909 | 3 |
| 1.610 | 1075 | 1 |
| 1.630 | 3000 | 1 |
| 1.635 | 3093 | 1 |
| Last trade - 09.41am 11/11/2024 (20 minute delay) ? |
Featured News
| HLS (ASX) Chart |
Day chart unavailable
The Watchlist
3DA
AMAERO INTERNATIONAL LTD
Hank Holland, Executive Chairman and CEO
Hank Holland
Executive Chairman and CEO
SPONSORED BY The Market Online


