MDS
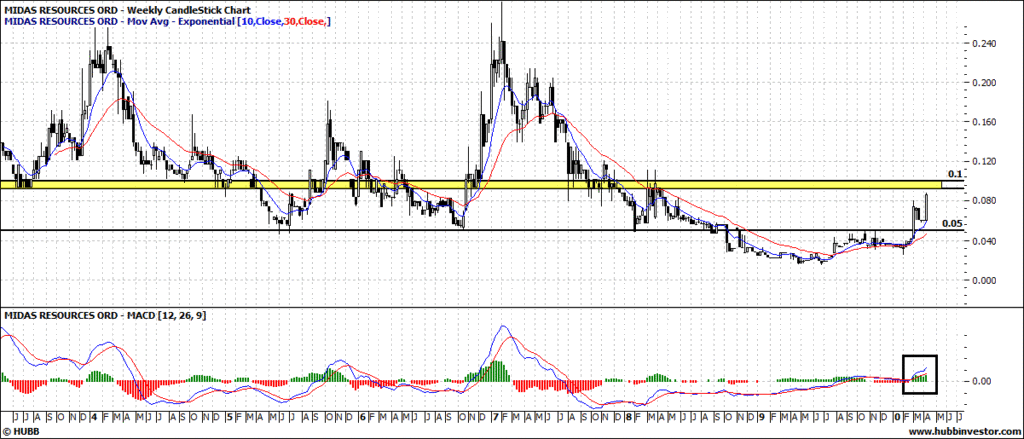
Weekly chart shows breakout from 18 month old sub-5c base.
That period looks to have given it a solid foundation and the 5c line should provide strong support should it drift back.
There is a prominent support and resistance zone, highlighted in yellow near the 10c line.
The weekly MACD has made a bullish cross and the 10wk and 30wk moving averages are looking good again too.
Will be a mover if it can crack the 10c area as it has done in the past.
Cheers,
10cents
- Forums
- ASX - General
- weekend charting 9 april
weekend charting 9 april, page-89
-
- There are more pages in this discussion • 126 more messages in this thread...
You’re viewing a single post only. To view the entire thread just sign in or Join Now (FREE)


