
5/3/23. Weekend Report - The Week That Was. Week Ended 3/3/23.
XJO Monthly Chart.
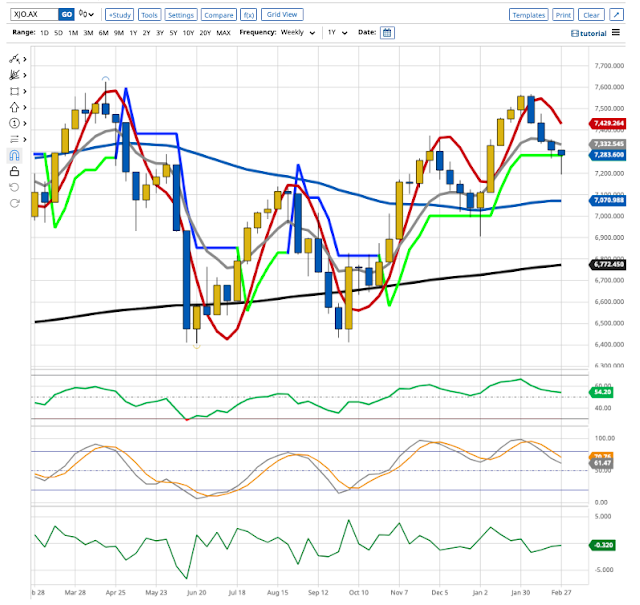
We've only had three days in March with the XJO up +0.35%. In February, XJO was down -2.92%So far, the Index is above the 8-MEMA, Hull MA13, 50-MMA, 200MMA, Supertrend (7/1.5). Not much damage done yet.Monthly RSI is at 54.31. 50 represents the dividing line between bullish and bearish.XJO Weekly Chart.XJO remains in an up-trend, with higher highs and higher lows. In the past five days, XJO fallen -0.32%. The previous week it was down -0.54%. So down side over the past two weeks has been modest.This week saw good buying during the week to erase most of the early losses.XJO began to fall four weeks ago at a major resistance level.8-Week EMA and Hull MA13 turned turned down, which is bearish. Supertrend continues to provide support this week. Events overnight on Friday in America could see a break to the upside.Weekly RSI is at 54.2 - bullish but falling.XJO Daily Chart.
This week, XJO was behind the eight-ball with a big fall on Monday. It has been up three of the past four days.My shortest term moving average is the Hull MA13. It turned down on the 9 Feb. It has now turned up, so the down-trend could be ending.I'd like to see the index finish above the 8-Day EMA (grey line) before feeling confident that the short-term trend has turned up. That seems likely to occur on Monday, given events in the U.S. on Friday night.Weekly Changes in Sectors.Breadth was poor this week, with only two sectors pushing to the upside - but those two sectors did extremely well, Energy +5.19% and Materials +3.98%.Financials, the biggest sector in the ASX, was down heavily -2.88%. It has been doing very poorly in recent times, but could be coming to the end of its pull-back.On the Thursday, XXJ fell heavily taking its RSI down to 26.6. We rarely see the RSI for XXJ get below 30 before we get some sort of a rebound. Watch XXJ on Monday for some good news for our market.Gold Miners.XGD (Gold Miners) was one of the stand-outs this week, up +6.42% after being down five weeks in a row. The bullish engulfing candle for this week suggests more upside for the Gold Miners. It has also bounced off support of the 50-Week MA - another bullish sign.NewHighs-NewLows.This is a long-term indicator, but a good guide for long-term investors.NH-NL pulled to the upside this week, with the 3-Day MA rising sharply. The 3-Day MA needs to get back above the 20-Day MA for long-term investors to feel comfortable about their investments. Until that happens, stay defensive.Stocks v Bonds. Relative performance.On a relative basis, Bonds are currently outperforming Stocks, i.e., the chart is below the zero level.This is a reasonable picture of bullish and bearish status of the market. It's probably a good idea for medium term investors to remain bearish on stocks while this chart remains below zero. If you're a bit cheeky, you might go long if the chart rises above the 10-Day MA.% of Stocks above key moving averages.1. % of stocks above 10-Day Moving Average: Last Week 44%, This Week 40%.2. % of stocks above 50-Day Moving Average, Last Week 56%, This Week 55%.3. % of stocks above 200-Day Moving Average, Last Week 65%, This Week 61%.The longer term measures remain above the 50% mark. So the market is not in bad shape. Short-term I'd like to see Stocks above 10-DMA move back above 50%.SP500.I mentioned, early in this report, the good results in America on Friday. Here's the SP500 chart.The past two sessions on the SP500 have seen strong upside moves. Friday saw a rise of +1.61%. That triggered a number of bullish indicators.Thursday saw the SP500 bounce strongly off the 200-Day MA - that's a bullish indicator. Friday saw the index cross above the 8-Day EMA, and the Supertrend changed from blue to yellow - bullish. Hull MA13 has turned up - bullish.This looks like the start of a good short-term upside rally.Conclusion.A lot of jig-saw pieces are falling into place for our market in the coming week. SP500 has turned short-term bullish and we should follow suit on Monday.
Indices 27/2, page-362


Add XJO (ASX) to my watchlist
 (20min delay) (20min delay)
|
|||||
|
Last
8,283.2 |
Change
-72.700(0.87%) |
Mkt cap ! n/a | |||
| Open | High | Low |
| 8,355.9 | 8,355.9 | 8,261.5 |
| XJO (ASX) Chart |