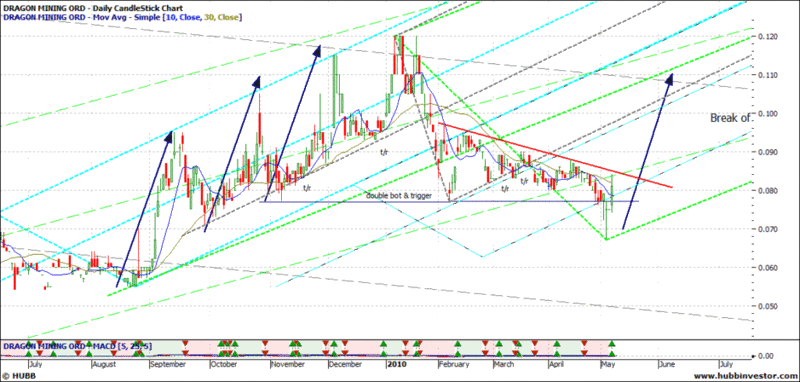
NTaylor I have a DRA chart working chart so quite busy but if you work thru chart I find it a very interesting one & have been thinking of an entry on occasions.
What I see:
-Price action conforms very well to the pitchforks (p/fs) shown
-Longer term blue p/f and its corresponding 1st and 2nd warning lines (shown in light blue) have numerous touches as support & res (shown as test/retest (t/r) on my charts)
-Jan down trend (d/t) led to the grey p/f) again many t/r confirming pattern and I found it interesting support tine almost overlaps blue 1st warning line
-Just added the green p/f this morn using the recent low as the low point (see close up view below)
-for those that look closely you will note the hor line that I had thought might be a double bot and actually was the trigger line for where I originally had grey p/f anchored (subsequently moved it to get more touches .. anyway probs too much detail but you can see that it has acted initially as support and then back tested as res in last few days action
- chart also shows a reasonable speed angle showing that the u/t capable of a quick break pout of several cents
-lastly the simple trend line showing recent d/t in red.

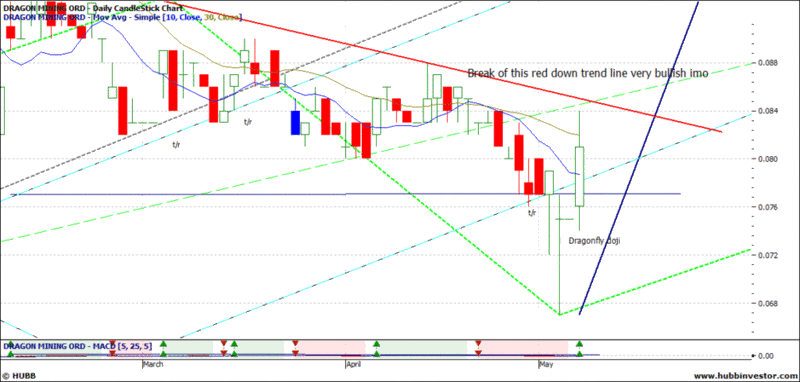
Now a close up. What I see:
-recent down trend line (red) looming just above price; a break of that bullish imo
-Thursday action was a Dragonfly Doji . Gotta love a dragonfly on dragon mining . Hope its draggin the price up??? :) LOL .
The Bullish Dragonfly Doji Pattern is a rare single candlestick pattern that occurs at the bottom of downtrend. It is very similar to the Bullish Hammer Pattern, except on a Dragonfly Doji the opening and closing prices are nearly identical (no body).
-maybe Dragonfly Doji will form the basis of the new green p/f require confirmation through a t/r signal.
GJ

- Forums
- ASX - General
- weekend charting elevator week 7th may
weekend charting elevator week 7th may, page-30
-
- There are more pages in this discussion • 57 more messages in this thread...
You’re viewing a single post only. To view the entire thread just sign in or Join Now (FREE)
Featured News
Featured News
SKS
SKS Technologies wins US$90M award to supply power to international hyperscale data centre in Melbourne
RNU
Renascor wins a funding boost given it wants to produce a critical mineral – but $5M award pales in comparison to some


