Hi saylor, hopefully I'm not adding to the FA/TA debate but would like to add a different take on it.
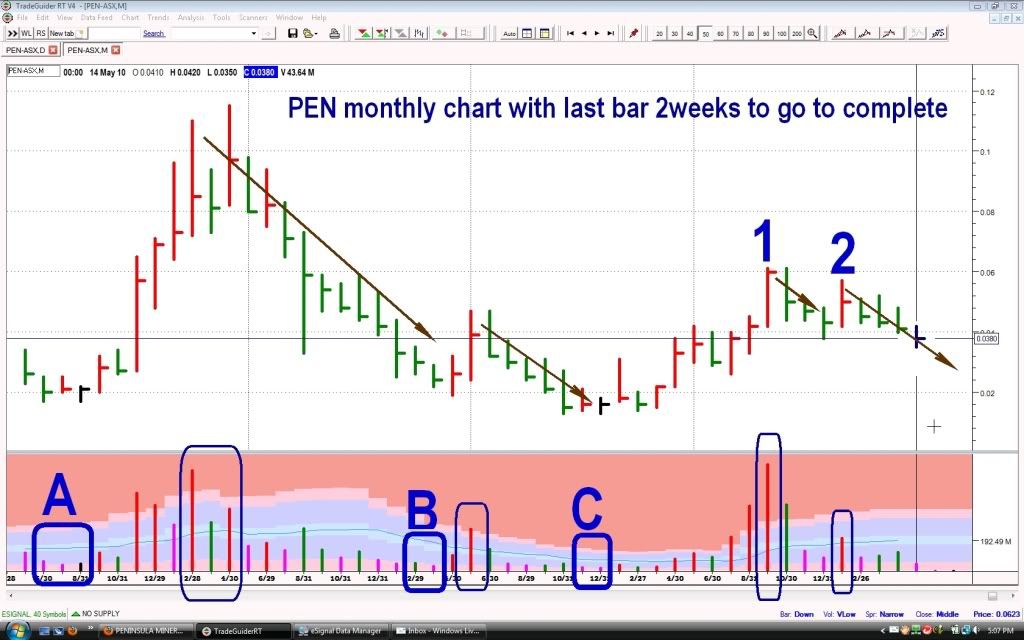
I've posted a monthly chart here, first thing to note is the last bar is only half complete so we can only imagine that the volume will at least match or pass the volume of last months - which if it does kind of implies a little bit of breaking down still.
I've highlighted the big volume UP months which as we can see normally brings a fall to the share price UNTIL we slow the selling to almost nothing as can be seen in the area's of A,B and C. We can see that the volume during those months is basically the smallest of any nearby and then the share price responses with positive movement soon after.
NOW if we look at BARS NO1. and NO2. we can see on those months especially bar no1 that the share price did not fall very much considering the HUGE amount of volume for it and then look back to areas of similar high volume and we can only think that maybe or quite possibly there is more downside to come and also if this current month exceeds last month for volume - these last three months will have or do not look anything like the volume at the previous areas where it responded upwards. So if a long term holder and believe in the FA of PEN there is possibly another period coming where one can accumulate more. Hopefully haven't been too confusing with my analysis. lol
- Forums
- ASX - By Stock
- PEN
- long term chart
long term chart, page-123
-
- There are more pages in this discussion • 328 more messages in this thread...
You’re viewing a single post only. To view the entire thread just sign in or Join Now (FREE)
Featured News
Add PEN (ASX) to my watchlist
 (20min delay) (20min delay)
|
|||||
|
Last
11.5¢ |
Change
0.005(4.55%) |
Mkt cap ! $366.3M | |||
| Open | High | Low | Value | Volume |
| 11.0¢ | 11.5¢ | 10.5¢ | $2.185M | 19.39M |
Buyers (Bids)
| No. | Vol. | Price($) |
|---|---|---|
| 13 | 1892350 | 11.0¢ |
Sellers (Offers)
| Price($) | Vol. | No. |
|---|---|---|
| 11.5¢ | 3719 | 1 |
View Market Depth
| No. | Vol. | Price($) |
|---|---|---|
| 13 | 1892350 | 0.110 |
| 24 | 4248795 | 0.105 |
| 85 | 10600209 | 0.100 |
| 7 | 578212 | 0.099 |
| 12 | 498440 | 0.098 |
| Price($) | Vol. | No. |
|---|---|---|
| 0.115 | 3719 | 1 |
| 0.120 | 7656657 | 65 |
| 0.125 | 2867667 | 22 |
| 0.130 | 2936575 | 19 |
| 0.135 | 2065362 | 13 |
| Last trade - 16.10pm 12/07/2024 (20 minute delay) ? |
Featured News
| PEN (ASX) Chart |


