Hi jutmeister, no need for any apologies we are all here to learn and bounce our many different and varying thoughts off one another that's the only way one may survive in this big bad market hey, anyway I may still have to kneel be fourth thou yet :))
Also thanks for the comments guys it makes one feel better been getting a bit of bashing on one other stock lately.
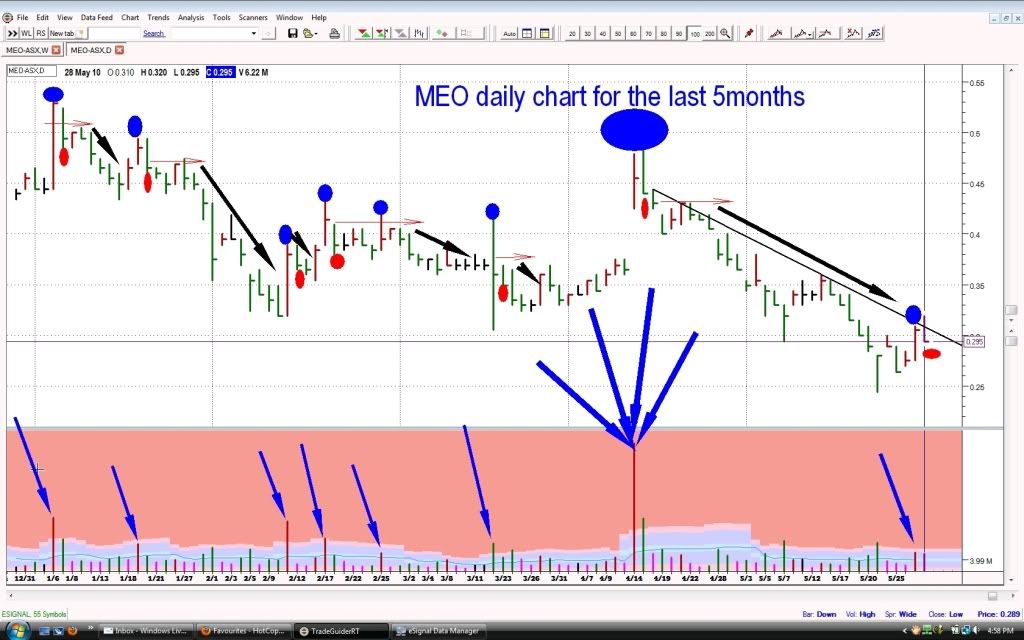
Funkymonk you continue to amaze me with your analysis keep it up son, to not take away from your fine work I will not repeat your finer detail of MEO's recent action but I will pan back to the last 5months.
I've put a fair bit of detail on this chart hopefully it will not confuse, but simply if we look firstly along the volume area and look for the bigger red volume bars (which are simply a bar that closes higher than the previous bar making it an up bar - and all high volume up bars should as Funkymonk has stated should be considered suss until proven otherwise). I have arrowed all of the high volume ups - now if we look to the matching price bars - they have the blue circles above them you will see a definite pattern to how these guys work.
Quite often the next day ( orange circle beneath ) closes down sharply - thus locking in the buyers from the previous day - then quite often the share price will walk the plank sideways on much less volume ( this is when the big boys are just standing aside ) the share price will then fall over ( black arrow ) before it bottoms out and the process may start again ( remember that they often are working in all different timescales )
Also note that the width of the first two days in this particular money making tactic the spread of the bars is also wider than normal - big spread big volume up and then big spread but slightly less volume down and then you are trapped if you bought on that breakout or announcement. The bigger the volume on these days appears to sometimes match the degree of damage that it does to the share price also.
Therefore jutmeister if we look at the last two days of the week we can see a similar setup happening, hopefully this removes my down ramping status :))))
P.S. also remember that we are only looking at the weakness on this chart - if we mirror image it we will basically see the strength ie. just flip the chart upside down and look instead of big high volume up days or bars for potential weakness - we look for the complete opposite big high volume ???? bars, easy hey

- Forums
- ASX - By Stock
- MEO
- why the big selloff ?
why the big selloff ?, page-25
-
- There are more pages in this discussion • 9 more messages in this thread...
You’re viewing a single post only. To view the entire thread just sign in or Join Now (FREE)
Featured News
Add MEO (ASX) to my watchlist
Currently unlisted public company.
The Watchlist
MTL
MANTLE MINERALS LIMITED
Nick Poll, Executive Director
Nick Poll
Executive Director
SPONSORED BY The Market Online


