I am in 2 minds about the current chart pattern for QBE. It could be a descending wedge (bullish) in which case it may soon bust out to test the top of the longer term channel again around $22 or the pattern could be a super bearish sloping head and shoulders in which if it breaches the current lows it could head back to the 09 lows very quickly.
Longer term it can be seen that the rally in the last year was nothing more than a move from the bottom of a bearish channel to the top. I have included a set of fib lines to take in all the major lows so far as a possible time/price guide to the next low at the channel bottom.....but that could all be the product of an overactive imagination so take that fwiw.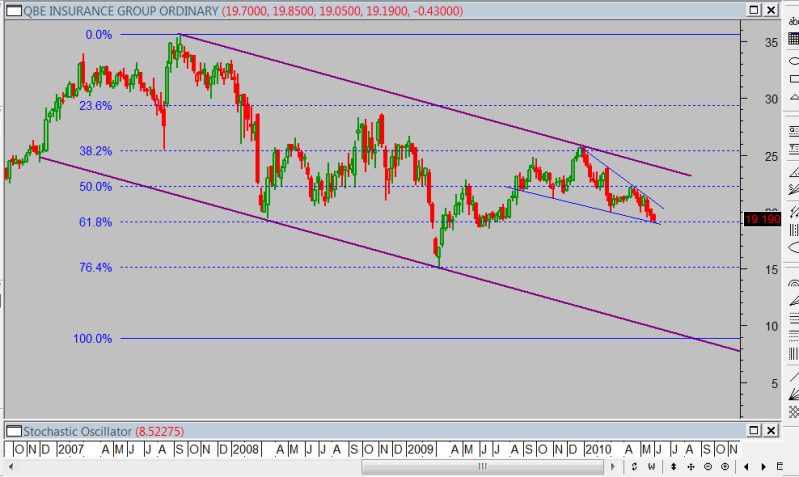
june 1 week, page-20


Featured News
Featured News
The Watchlist
LU7
LITHIUM UNIVERSE LIMITED
Iggy Tan, Executive Chairman
Iggy Tan
Executive Chairman
Previous Video
Next Video
SPONSORED BY The Market Online