NO ADVICE GIVEN, JUST MY HUMBLE OPINION ONLY, ALWAYS DO YOUR OWN RESEARCH.
First Chart is XPJ, I think EMA 195 will pull her up and also act as a resistance, but I think she will break it.
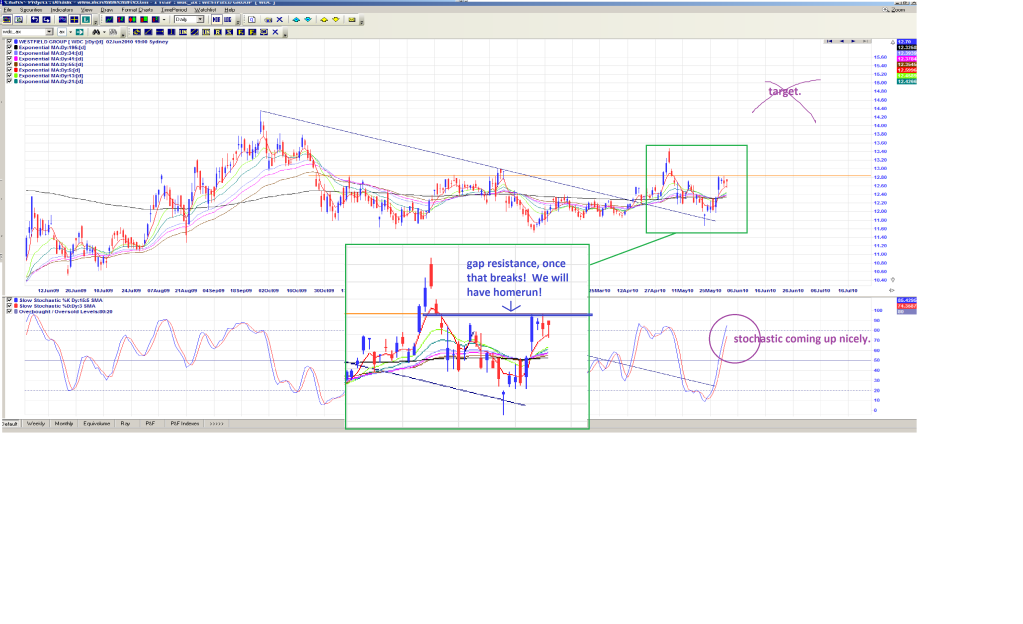
Second chart is WDC, EMA 5 has crossed all of the EMA's daily stochastic is coming up nicely. She gapped up on Friday and today was the forth day of trading and the bears have failed to push her back down that gap, this is bullish to me. Watch how all the EMA's move, 5 is above 13, 13 is above 21 so on and so for. Once the $12.82 resistance breaks, she will fly, I reckon.
Add to My Watchlist
What is My Watchlist?


