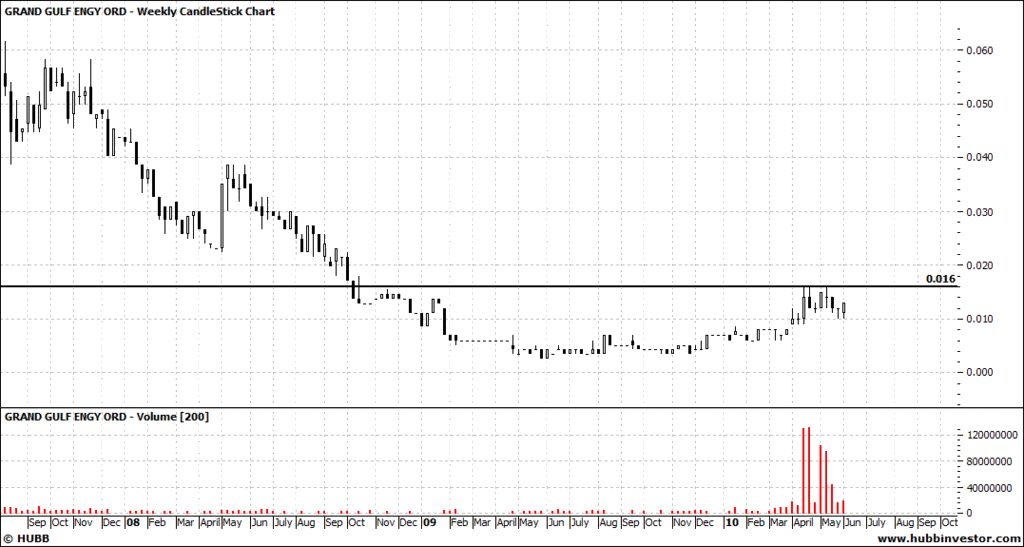
GGE weekly chart shows a bullish cup & handle formation.
A huge spike in volume recently has accompanied the top of the cup and the handle.
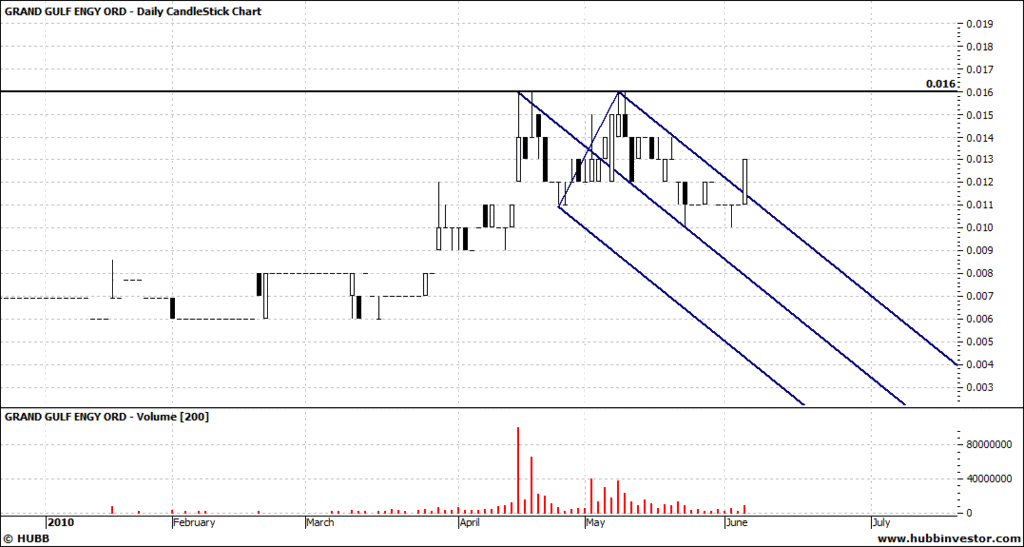
1.6c is clearly the line to break.
The daily's a bit difficult to chart with lack of activity but there is one nice fitting downtrending pitchfork that has been broken so a good sign there too.
It shows 1.6c as spikes and 1.5c has the highest close.
- Forums
- ASX - General
- weekend charting 5-6 jun


