A red candle on the Dow Jones caught my attention.
So how does it all look, what are the possibilities?
CHART 1. Red Candle Theory.
Last nights red candle not long enough to qualify so it's treated as a normal candle. Nice to see it test the breakout line of 10,250.
CHART 2.
Short term pitchfork also giving support at 10,250. So if the Dow can stay above 10,250 tonight it will remain in short term bull territory.
CHART 3.
Weekly highlighting significant doji.
CHART 4. Monthly
Consolidation seems to be playing out to form.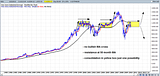
trade what you see wednesday, page-32


Add XJO (ASX) to my watchlist
 (20min delay) (20min delay)
|
|||||
|
Last
8,075.7 |
Change
87.800(1.10%) |
Mkt cap ! n/a | |||
| Open | High | Low |
| 7,987.9 | 8,079.0 | 7,979.5 |
| XJO (ASX) Chart |