kcmir
Looking at mid 07 - 08, up july, big down August rally to years end. Both now and than have H & S patterns except the price range and time is played out to a larger degree in 07-08. We have the same broadening wedge but price and time is lesser on both parts. If we were to follow 2008 next year, 2011 will be a very good year to accumulate.
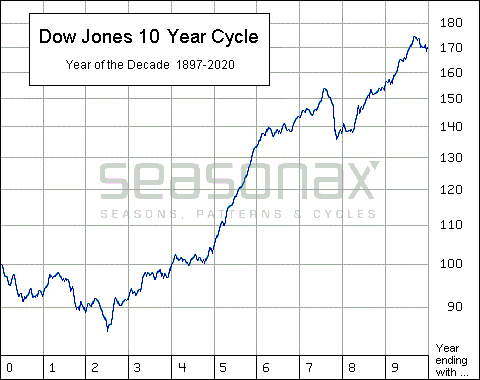
Just for reference point I have added a 10 year cycle of the DOW that has been averaged out over 106 years. Notice late 2007-2008

2007 - 2008
http://e6.md.it-finance.com/MDV8/tmp/img_12772953958990.gif
2010

Please DYOR.......Long for the next few days!!!
I will go and hide around the curtain and wait..........

- Forums
- ASX - By Stock
- XJO
- trade what you see wednesday
XJO
s&p/asx 200
Add to My Watchlist
0.90%
 !
8,639.0
trade what you see wednesday, page-106
Featured News
Add to My Watchlist
What is My Watchlist?
A personalised tool to help users track selected stocks. Delivering real-time notifications on price updates, announcements, and performance stats on each to help make informed investment decisions.
 (20min delay) (20min delay)
|
|||||
|
Last
8,639.0 |
Change
77.200(0.90%) |
Mkt cap ! n/a | |||
| Open | High | Low |
| 8,561.8 | 8,641.3 | 8,561.8 |
Featured News
| XJO (ASX) Chart |
The Watchlist
LU7
LITHIUM UNIVERSE LIMITED
Iggy Tan, Executive Chairman
Iggy Tan
Executive Chairman
SPONSORED BY The Market Online


