Firstly let me say I am no expert on elliott waves so I am open to some lively responses. I know you all have been talking spx but could the XJO see a 5 wave down rather than 3. Here is a modified vesion of a chart I put up last night that highlighted how Voltaire's expected 8/7/2013 end to the XJO bear fitted perfectly into the fibonacci structure of what has happened so far and with what I have been expecting to happen. The first wave down is as y'all have been saying ending in March 2009 and taking exactly to the day 23.6% of the total time. The next 801 day section is exactly to the day 38.2% of the total time and is exactly divided into 2 by the high at april 15. April 15 as you all have said would be end wave 2. I have wave 3 being the other half of the first 801 day period ending 20/5/2011. This is very close to the anniversary of the May 19th 2008 rally top and the sharp low of May 21 this year....but perhaps more importantly if I do an equiv time line for the US our may 20 is their June 12 which is right at the Armstrong low....As I have mentioned before out of the last 10 Armstrong cycles 9 have seen very bullish activity for the first 26 months after the low so chances are we will see the same again causing us to have a wave 4 rally....I am still considering where wave 4 could end but I note that October 2012 will be the next cycle hit for Voltaire's world famous 30 month cycle...and in April we all saw first hand how well that works. Other than that maybe we again look to the fibonaci subdivisions.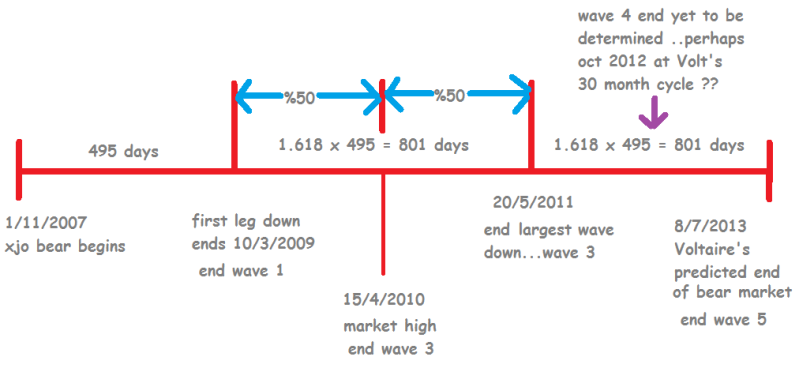


Add to My Watchlist
What is My Watchlist?
 (20min delay) (20min delay)
|
|||||
|
Last
8,877.7 |
Change
24.700(0.28%) |
Mkt cap ! n/a | |||
| Open | High | Low |
| 8,853.0 | 8,888.0 | 8,853.0 |
| XJO (ASX) Chart |