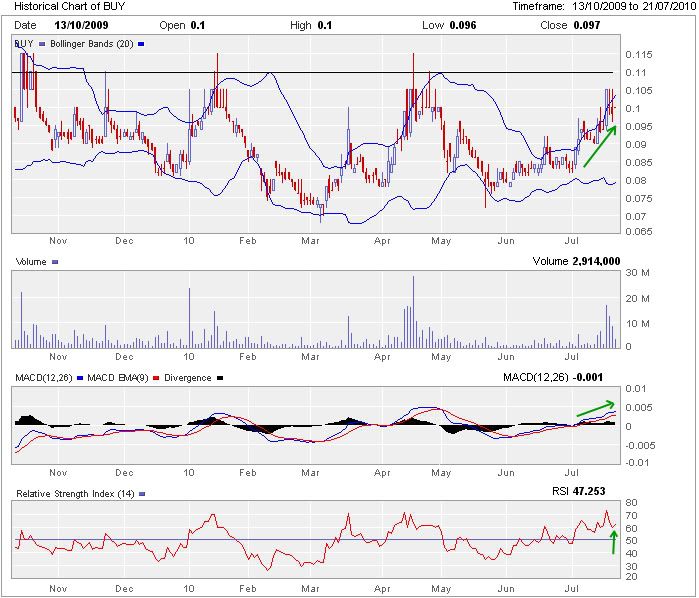
It's a lovely sight to see it above 10c but the real break out will be if it passes 11c and stays there for a few days.
Here's a chart below to show what's happening at the moment

Note the line along the ceiling at 11c. Really needs to break that and hold to confirm a breakout.
MACD is uptrending which is good for the short term but needs to not get too far out of control as we don't want the blue to cross over the red too early. RSI is high but usually is after a few up days. The important thing to note is that the SP is following that top bollinger band though which if it can close above that for a few days on decent volume then we could be looking at a breakout to the upside. Note that it's had the same trend before twice in the last 7 months both in Jan 2010 and Apr 2010. Although this looks stronger and more promising it's best not to get too excited just yet but cross fingers and hopefully we'll be pleasantly surprised.
Good luck and as always DYOR
- Forums
- ASX - By Stock
- BUY
- breakout
breakout, page-3
-
- There are more pages in this discussion • 25 more messages in this thread...
You’re viewing a single post only. To view the entire thread just sign in or Join Now (FREE)
Featured News
Add BUY (ASX) to my watchlist
 (20min delay) (20min delay)
|
|||||
|
Last
0.6¢ |
Change
-0.001(8.33%) |
Mkt cap ! $8.241M | |||
| Open | High | Low | Value | Volume |
| 0.6¢ | 0.6¢ | 0.6¢ | $1.253K | 212.0K |
Buyers (Bids)
| No. | Vol. | Price($) |
|---|---|---|
| 5 | 2833907 | 0.5¢ |
Sellers (Offers)
| Price($) | Vol. | No. |
|---|---|---|
| 0.6¢ | 5293353 | 8 |
View Market Depth
| No. | Vol. | Price($) |
|---|---|---|
| 5 | 2833907 | 0.005 |
| 17 | 7716851 | 0.004 |
| 13 | 13759236 | 0.003 |
| 10 | 9030011 | 0.002 |
| 9 | 27000000 | 0.001 |
| Price($) | Vol. | No. |
|---|---|---|
| 0.006 | 5293353 | 8 |
| 0.007 | 1838429 | 5 |
| 0.008 | 655000 | 2 |
| 0.009 | 2293820 | 6 |
| 0.010 | 2071714 | 4 |
| Last trade - 15.54pm 01/11/2024 (20 minute delay) ? |
Featured News
| BUY (ASX) Chart |


