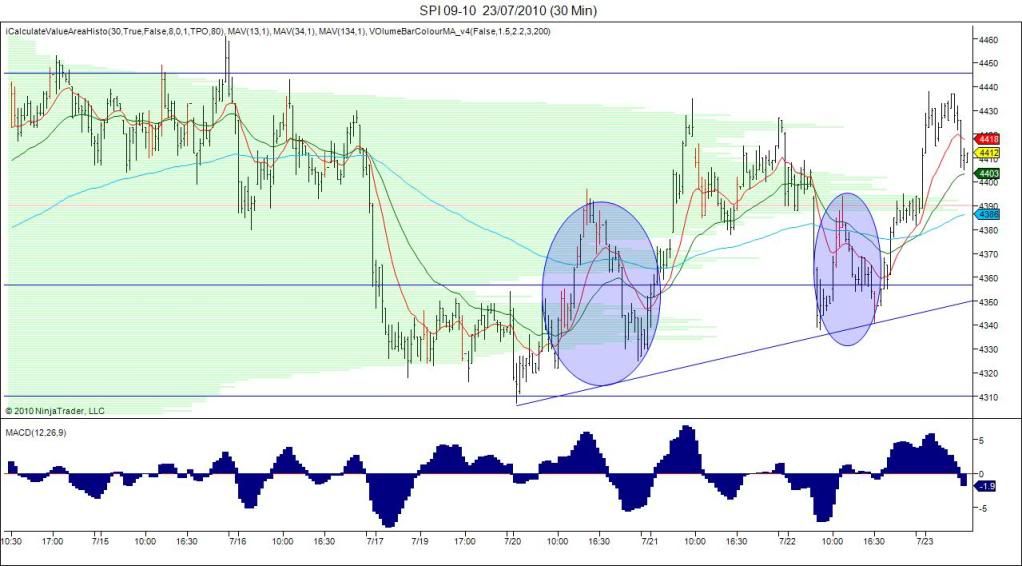
In saying I'm a buyer of support today, dosen't mean things can't change, as I've said i can't predict anything I don't have the skill.On this chart below , it's clear we still haven't broken out of the current trading bracket, the value price is 4390 and value tends to attract price action .Two patterns repeated below the value line both show the bars in red pushing price higher , red bars are higher than average volume bars.macd negative, price above value but buying having taken place in the background.I'm still happy to buy support and if we can break the bracket I'll stay long, but if we dont i won't hold a position.'These are volitile times.
- Forums
- ASX - By Stock
- XJO
- friday
XJO
s&p/asx 200
Add to My Watchlist
0.32%
 !
8,773.5
friday, page-14
Featured News
Add to My Watchlist
What is My Watchlist?
A personalised tool to help users track selected stocks. Delivering real-time notifications on price updates, announcements, and performance stats on each to help make informed investment decisions.
 (20min delay) (20min delay)
|
|||||
|
Last
8,773.5 |
Change
28.300(0.32%) |
Mkt cap ! n/a | |||
| Open | High | Low |
| 8,745.2 | 8,821.0 | 8,745.2 |
Featured News
| XJO (ASX) Chart |


