AKQ re the trajectory increase
and further to basic technical compliance chat on the other gap thread;;;
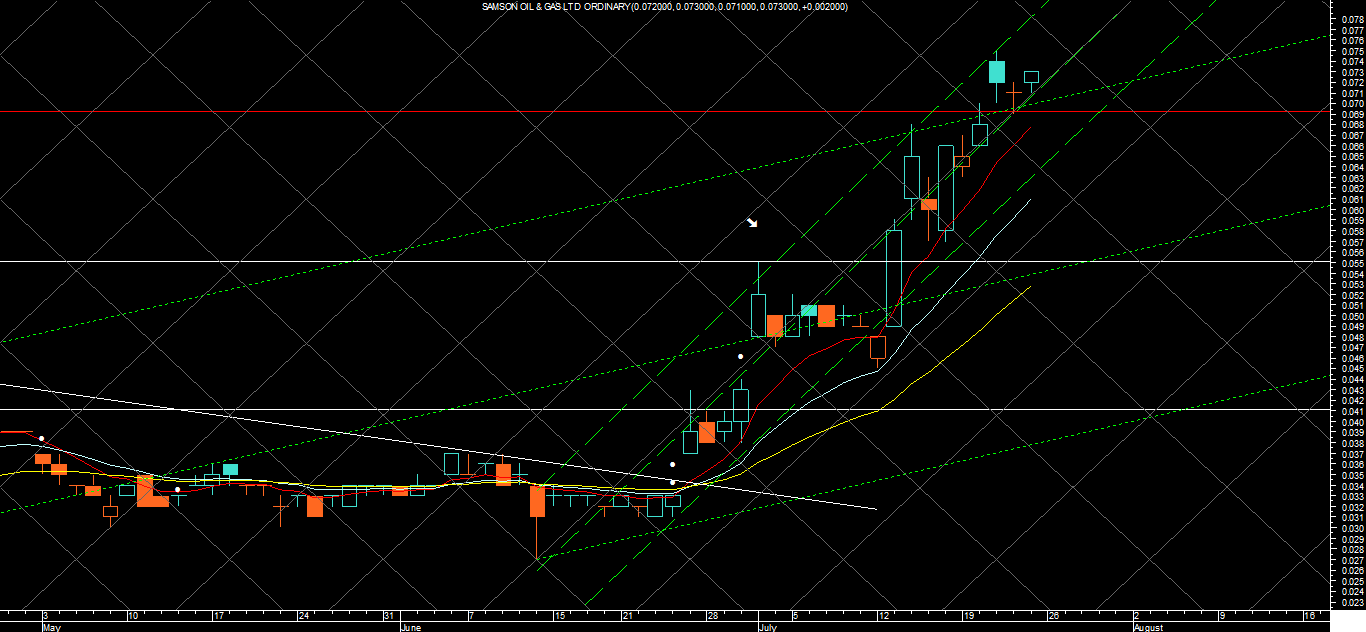
I was just looking at the (broken green) Standard error trading channel , since the 11/07 start at 27 and noticed today it is precisely at 45% so I laid a 45% Gann grid over it, Its just we mentioned it earlier and breaks in degrees can be used as trading triggers .One of ganns observations was the pattern of trade support/resistance at certain angles.
Its called a Gann Fan...
here we go
just found this..
Gann Angles are drawn between a significant bottom and top (or vice versa) at various angles. Deemed the most important by Gann, the 1 x 1 trendline signifies a bull market if prices are above the trendline or a bear market if below. Gann felt that a 1?x?1 trendline provides major support during an up-trend and when the trendline is broken, it signifies a major reversal in the trend. Gann identified nine significant angles, with the 1 x 1 being the most important:
1 x 8 - 82.5 degrees
1 x 4 - 75 degrees
1 x 3 - 71.25 degrees
1 x 2 - 63.75 degrees
1 x 1 - 45 degrees
2 x 1 - 26.25 degrees
3 x 1 - 18.75 degrees
4 x 1 - 15 degrees
8 x 1 - 7.5 degrees
Note that in order for the rise/run values (e.g., 1 x 1, 1 x 8, etc.) to match the actual angles (in degrees), the x- and y-axes must have equally spaced intervals. This means that one unit on the x-axis (i.e., hour, day, week, month, etc.) must be the same distance as one unit on the y-axis. The easiest way to calibrate the chart is make sure that a 1 x 1 angle produces a 45 degree angle.
Gann observed that each of the angles can provide support and resistance depending on the trend. For example, during an up-trend the 1?x?1 angle tends to provide major support. A major reversal is signaled when prices fall below the 1 x 1 angled trendline. According to Gann, prices should then be expected to fall to the next trendline (i.e., the 2 x 1 angle). In other words, as one angle is penetrated, expect prices to move and consolidate at the next angle.
Gann developed several techniques for studying market action. These include Gann Lines, Gann Fans, and Gann Grids.
PS obviously this means nothing in terms of SSN current targets but will show current failure angles/levels and ideal trading behaviour in the future..
PS this may just read as Bull Ship to folk but its also good revision for others of us...cheers
calm before the storm, page-32
-
- There are more pages in this discussion • 2 more messages in this thread...


You’re viewing a single post only. To view the entire thread just sign in or Join Now (FREE)