Nice finish to the week this is an extract from my weekend trading journal.. apologies if you have seen some of the seasonal charts before but some havnt.
firstly trend model:
XJO Finished up 0.81% for the week
With longer term trends turning up towards the end of the week when the 4450 area was breached with some conviction.
We also have a confirmed higher swing low from early july.
long term:
This is my ideal scenario. Sideways pattern until mid august then down until October.
C Wave targets are derived from extensions of A assuming the high in may is not breached.
The 0.618 ext target happens to line up with the 50% retrace from 09->april 2010 which adds credibility to a support. This lies around 4060.
0.618 is the typical ratio of C to A however 1:1 is also important to watch out for.
Anything greater than this would rule out this as a correction and would add credibility to the dire 3rd wave down prechter has been harping on about.
zooming in:
I am treating this as an ABC Correction within a larger sideways consolidation before 1 last push down.
As you can see overnight we reached zone 1 resistance which should not end the bounce but temporarily delay the advance. This is the wave 1 of A price extension 100% imposted on B Low. The 61.8% extension of wave A on B and also the psychological 4500 round number all should provide some barrier to price.
Zone 2 is formed from 1.272 extension of wave 1 of A, it also Aligns with the APRIL-> June lows as the 50% line in the sand. Around 4550.
Zone 3 is the 100% Extension of A which would make C=A and it is also the 161.8% extension of wave 1 of A. Around 4625
And then we have the decending trendline which has proved resistance in the past as you can see in the first chart. If you look back in 2007(not shown) this line provided some important support/res.
anything above the 4650 would kill this count.
Looking briefly at COT Index Data:
You can see that towards the end of the week the large traders(green) have moved in whilst the small speculators(red) have moved out this is somewhat healthy for a continued advance. However do note that this data is delayed. It is compiled on Tuesday and released on Fridays.
In net positions:
indexed relative to previous:
Cycles and Seasonals:
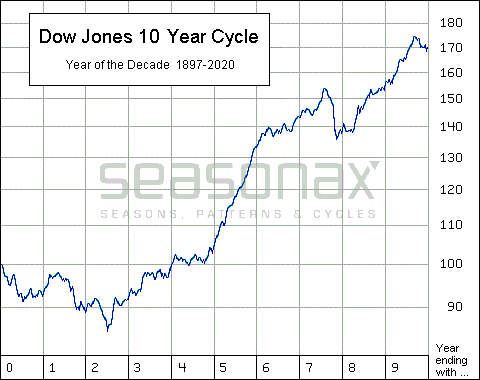
Average decade pattern says years ending with 0 e.g. 2010 are usually weak.
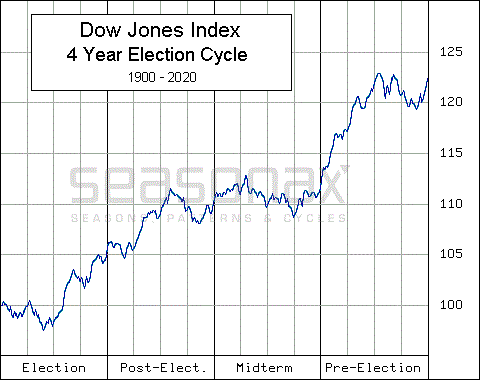
The 4 year cycle suggests that midterm election years are sideways for the most and then begin to gain momentum towards the end of the year.
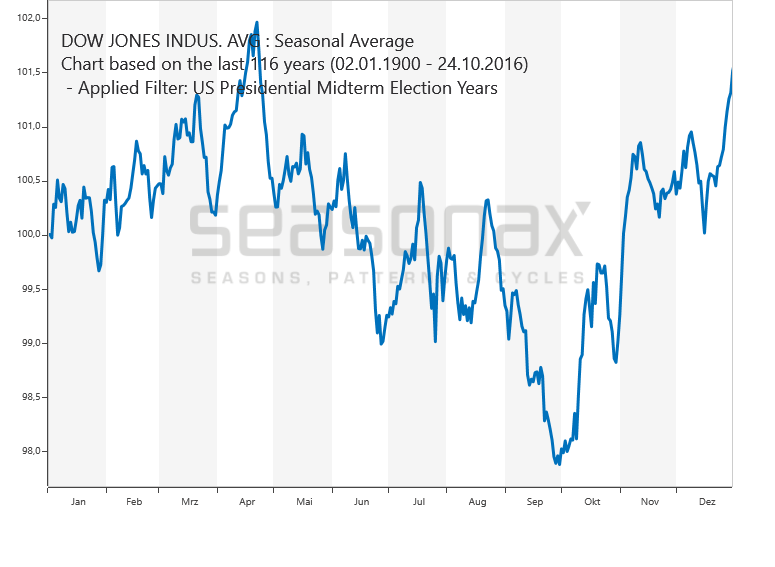
Zooming in we can see that the average midterm election year is weakest from late august to early October.
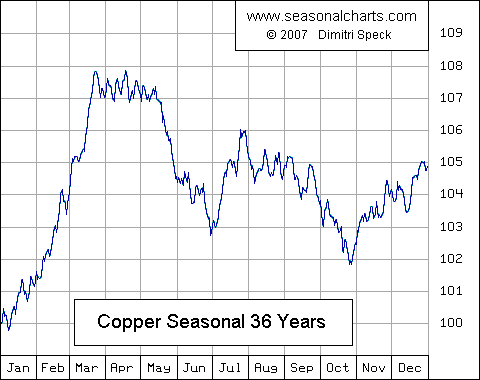
Copper:
after breaking out late last week this is my take on the ETF i trade
Looking at copper the 50% level of the previous decline has been tagged and has provided some resistance copper ETF opened(Friday) slightly down ran up to tag this level and then closed near it opened.
Whilst I doubt it will completely end the advance it should delay it in the short term. I do believe this instrument does have a little more to go over the next 2 weeks.
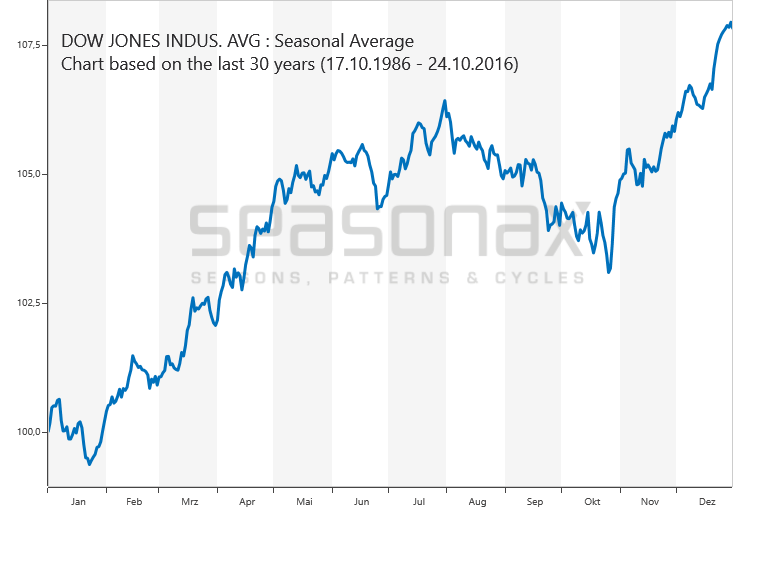
seasonal:
USDX:
Dollar bulls would probably use this count or something similar.
After tagging the 50% retrace from low to high its ready for another rally similar to December-> May.
But cycles say down:
See
http://www.hotcopper.com.au/post_single.asp?fid=275&tid=1215890&msgid=6830397
Summary:
Expecting short term strength to continue after a small pause/correction for the next couple weeks at least then down into October.
have a good weekend!
- Forums
- ASX - By Stock
- XJO
- weekend thread
XJO
s&p/asx 200
Add to My Watchlist
1.37%
 !
8,757.2
weekend thread
Featured News
Add to My Watchlist
What is My Watchlist?
A personalised tool to help users track selected stocks. Delivering real-time notifications on price updates, announcements, and performance stats on each to help make informed investment decisions.
 (20min delay) (20min delay)
|
|||||
|
Last
8,757.2 |
Change
118.200(1.37%) |
Mkt cap ! n/a | |||
| Open | High | Low |
| 8,639.0 | 8,776.4 | 8,639.0 |
Featured News
| XJO (ASX) Chart |


