Moving Averages:
Hi all, on the w/end charting there was some interesting (to me) chat re use of MAs in charting (thanks Kooke & Sharks & others for contributing). I have been "playing around" a bit with MA's and there use & was thinking of a post with my thoughts.
WARNING: My thoughts are likely to be "lengthy" with lots of charts and will aim to cover usefulness of different MA time frames, MACD and the like. Is anyone interested? If yes I will post it under CHARTS but with a different thread title so it does not clog this thread!
For now I will post one of the first charts as a practiceas I am trying out the thumbnails technique as I too want to play like the cool kids. LOL (Thanks T91 for "How to" & the more observant among u might have noticed my sexy heading & some italics at end: HTML me up!!!!)
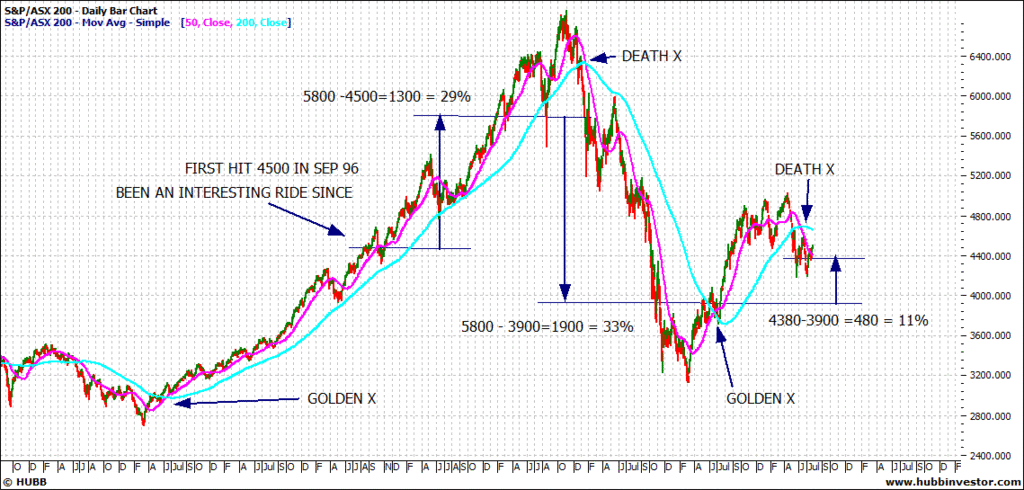
As a celebration of the asx200 yet again crossing 4500 points (its done that on more than 10 occasions) the chart tests whether dollars could have been made by following one of the most BASIC MA techniques since it first hit 4500 in 2006. The cross of the 50 & 200day MA.
In summary if you had used the so called death cross and golden cross as a enter/.exit technique the chart shows that instead of the asx 200 staying still for 4 years you could have had 3 VERY LOW RISK trades of 29, 33 and 11%; gives a compound return of 90% not bad IMO?
Confession: Unfortunately I did NOT make 90% in the last 4 years (& I was using much higher risk techniques than a dumb old MA cross.)
GJ
- Forums
- Charts
- week 26072010
week 26072010, page-44
-
- There are more pages in this discussion • 86 more messages in this thread...
You’re viewing a single post only. To view the entire thread just sign in or Join Now (FREE)
Featured News
CC9
Chariot Corporation (ASX:CC9) refines Black Mountain strategy, launching Pilot Mine to seize U.S. lithium opportunity
NEWS
Antler Copper Project hits major permitting milestone – air quality permit advances to final review


