ok today is a big day in nine lives world. Once again we are at a major fib time division. In mid July I predicted we would dip because of the XJO time fib but recover somewhat into today (US fib time division).....I did not expect the XJO to do so well but there you go. I guess time fibs are like price fibs which we are all familiar with. If price is gonna bounce it will most likely happen at a fib line....or it may just flitter about at the fib line for a while (I believe we call that consolidation)and then continue in the same direction....and occasionally it may just pass straight through the fib line like a bad Indian curry.
What happens tonight I can't say for sure. The SPX peaked a few nights ago so maybe the time fib merely marks a very minor bottom.....or perhaps the GDP figure will see tonight mark a massive fall with a volume peak. So far all other time fibs we have passed through in the US have marked an important high or low. I have turned the SPX chart on it's side and drawn fib lines that may appear to be in a more familiar format.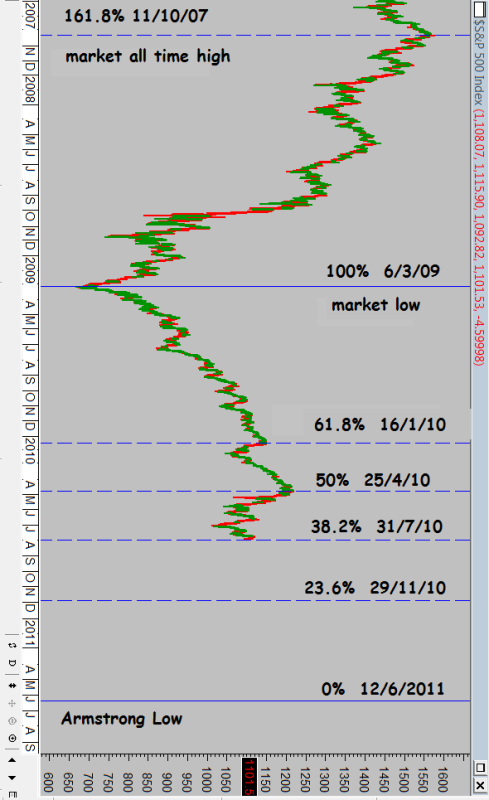


Add to My Watchlist
What is My Watchlist?
 (20min delay) (20min delay)
|
|||||
|
Last
8,575.2 |
Change
-55.100(0.64%) |
Mkt cap ! n/a | |||
| Open | High | Low |
| 8,630.3 | 8,630.3 | 8,544.7 |
| XJO (ASX) Chart |