Had a request from a (non TA) mate for RXM so thought I would share charts and my email comments to him.
rxm chart 1; move up looks to have completed price moved within pitchfork in a classic manner (its that retest at bottom I use as a buy trigger; shame we were not looking on 29/6; chart would have predicted move up) other notes on chart
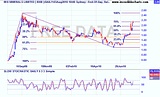
rxm 2 has fibbonachis shown (they are spooky) note how price honours the 50% fib on way down? price was capped for a while at 38% on recent rally; jumped to 50% went to 75% but retested the 50% before agin testing 75% today
My conclusion; looks to have completed its range and every possibility of needing to time to "absorb" the 100% increase IMO
As always welcome any comments.
By the way these charts combine pitch forks, measured move/speed angle and fib's. Starting to use this combo more and more and observing a 50% fib retracement is likely to coincide with a med line on a p/f (of course)and with the mid point of a MM. Anyone got any "words of wisdom" on this?