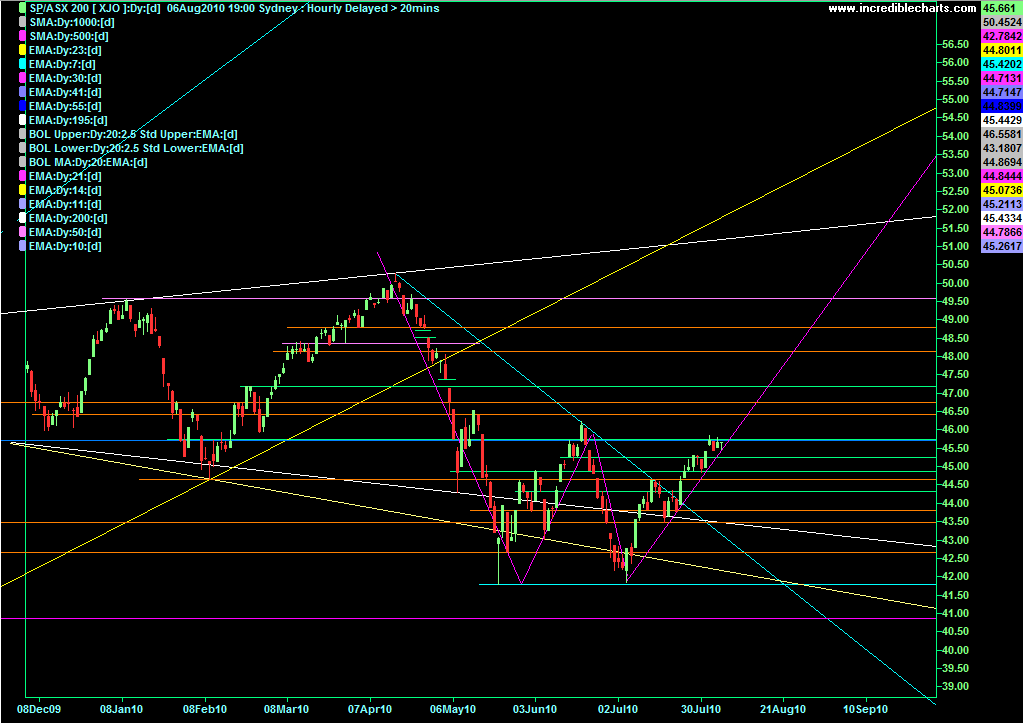
Despite other reasons both fundamental and technical I think from a very simple point of view that "W" recovery chart formation is playing out beautifully here imo.
Ignoring all the other trendlines on my chart below have a look at the pink lines.. speaks for itself on where it's going imo. SPX & DJIA look very similar. Too perfect to ignore IMO.
XJO daily

- Forums
- ASX - By Stock
- XJO
- untoward friday
XJO
s&p/asx 200
Add to My Watchlist
0.70%
 !
8,630.3
untoward friday, page-120
Featured News
Add to My Watchlist
What is My Watchlist?
A personalised tool to help users track selected stocks. Delivering real-time notifications on price updates, announcements, and performance stats on each to help make informed investment decisions.
 (20min delay) (20min delay)
|
|||||
|
Last
8,630.3 |
Change
59.900(0.70%) |
Mkt cap ! n/a | |||
| Open | High | Low |
| 8,570.4 | 8,632.8 | 8,570.4 |
Featured News
| XJO (ASX) Chart |
The Watchlist
HAR
HARANGA RESOURCES LIMITED.
Peter Batten, MD
Peter Batten
MD
Previous Video
Next Video
SPONSORED BY The Market Online


