golfzoner, apologies for missing this, I was away from HC for a few days. As totters has said the KAR crowd can get a bit tough from a chartists point of view. I try and keep it simple as far as my charts go and most of the time it's pretty clear that the big money trading this stock likes to keep it simple also as it's evident on the chart below that simple trendlines and support/resistance lines play a major roll in sp direction. I use some indicators but find that the slow stochastic is the best tool indicator wise imo. I also follow the fundamentals of this stock being fortunate to have a family member with a connection to the company but admiteditly it is of little use lol. All I can say is that nothing has changed this the last time I posted regarding this (which was ALL positive).
Totters this is only my view and I am only responding to golfzoner so hope that's cool. My charting is not as in depth or extensive as yours so it's really just another perspective.
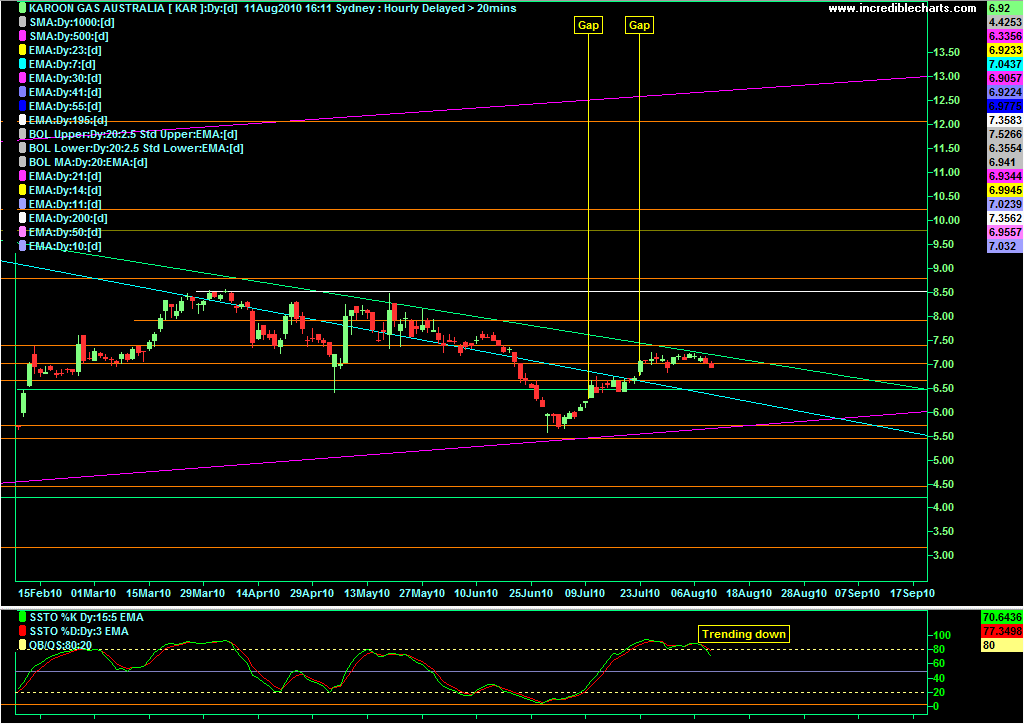
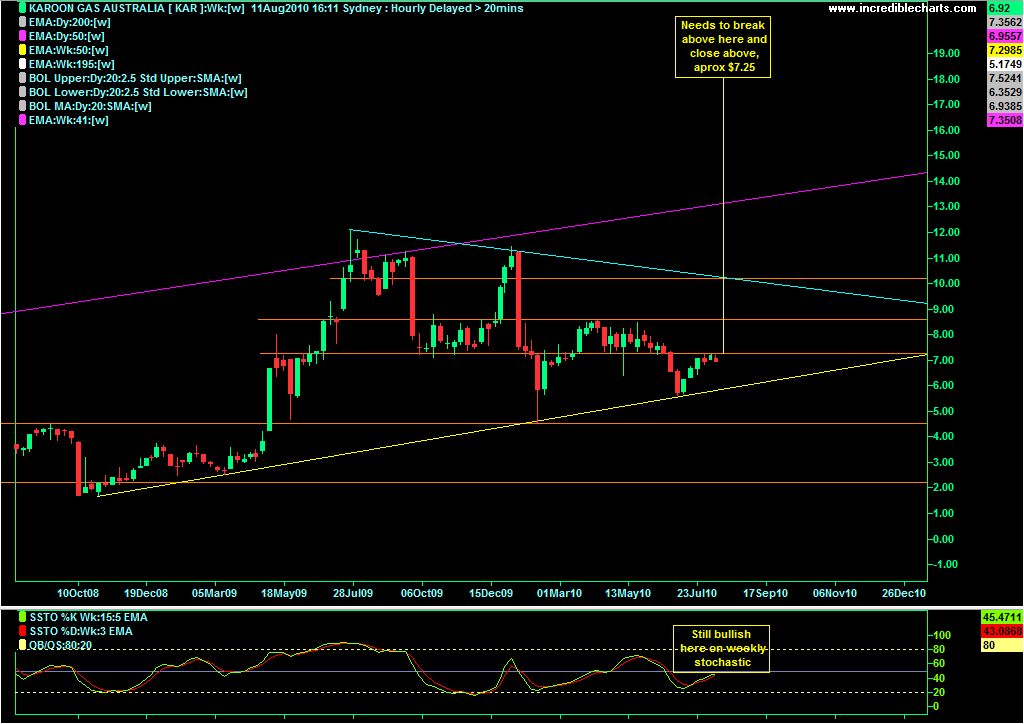
Looking at the daily chart first, there is two gaps, one at $6.23 -$6.28 & another $6.74 -$6.77. Going by current market sentiment & direction it would appear that these two gaps may get filled in coming sessions but I guess that depends on whether you think the general market will see more downside or reverse back up. Clearly the green descending trendline just above the current sp is giving off lots of resistance as the price couldn't get over it even with a bullish market last week which is a little concerning. My explanation for this is because the daily stochastic was in overbought and was overbought for the best part of July. This keeps the big players away imo (unless there is news etc which would over rule this theory). The daily stochastic is trending down now as you can see which is a worry for the st. The question is will it go down to the oversold area? If so this should coincide with that blue descending trendline which was a pest from March - June. As far as looking for a bottom goes (unless the market falls off a cliff) I would look to the yellow ascending trendline on the weekly for a likely support area IMO.
DAILY chart - 6 months (close up) with daily slow stochastic

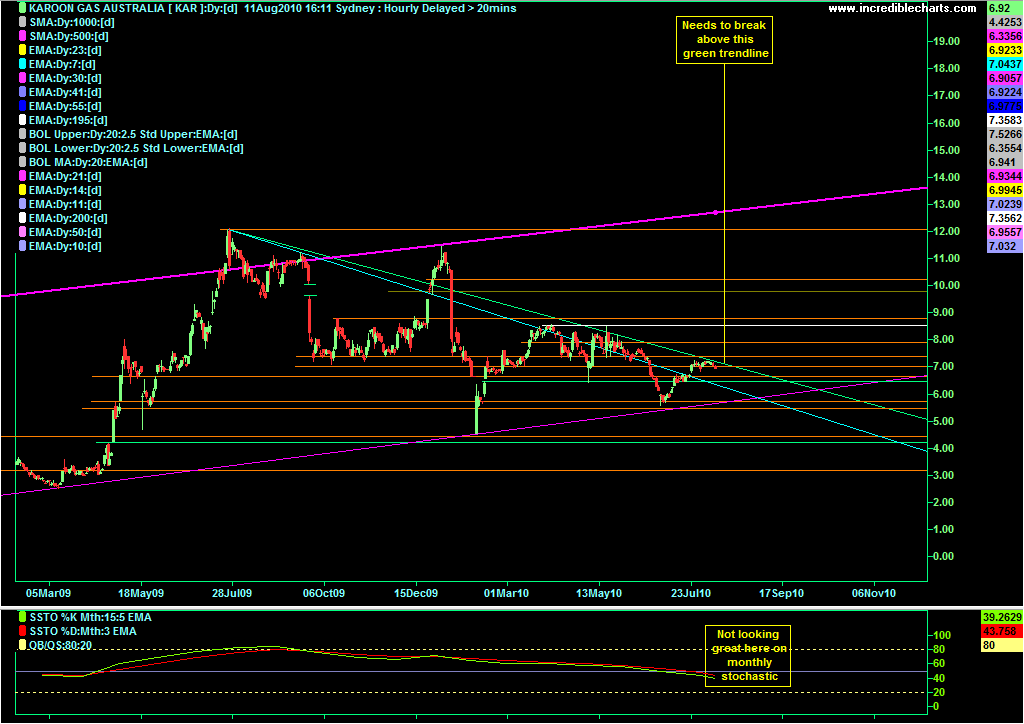
DAILY chart - 18 months with MONTHLY slow stochastic

WEEKLY chart - 2 years with WEEKLY slow stochastic

- Forums
- ASX - By Stock
- KAR
- come in chartists
come in chartists, page-17
-
- There are more pages in this discussion • 2 more messages in this thread...
You’re viewing a single post only. To view the entire thread just sign in or Join Now (FREE)
Featured News
Add KAR (ASX) to my watchlist
 (20min delay) (20min delay)
|
|||||
|
Last
$1.75 |
Change
-0.020(1.13%) |
Mkt cap ! $1.403B | |||
| Open | High | Low | Value | Volume |
| $1.78 | $1.79 | $1.74 | $5.751M | 3.281M |
Buyers (Bids)
| No. | Vol. | Price($) |
|---|---|---|
| 2 | 61567 | $1.75 |
Sellers (Offers)
| Price($) | Vol. | No. |
|---|---|---|
| $1.75 | 38973 | 2 |
View Market Depth
| No. | Vol. | Price($) |
|---|---|---|
| 2 | 61567 | 1.745 |
| 4 | 119009 | 1.740 |
| 4 | 103391 | 1.735 |
| 12 | 218125 | 1.730 |
| 8 | 79849 | 1.725 |
| Price($) | Vol. | No. |
|---|---|---|
| 1.750 | 38973 | 2 |
| 1.755 | 158338 | 5 |
| 1.760 | 57088 | 4 |
| 1.765 | 35782 | 3 |
| 1.770 | 5782 | 1 |
| Last trade - 16.10pm 15/08/2024 (20 minute delay) ? |
Featured News
| KAR (ASX) Chart |
The Watchlist
I88
INFINI RESOURCES LIMITED
Charles Armstrong, CEO & Managing Director
Charles Armstrong
CEO & Managing Director
SPONSORED BY The Market Online


