LYC
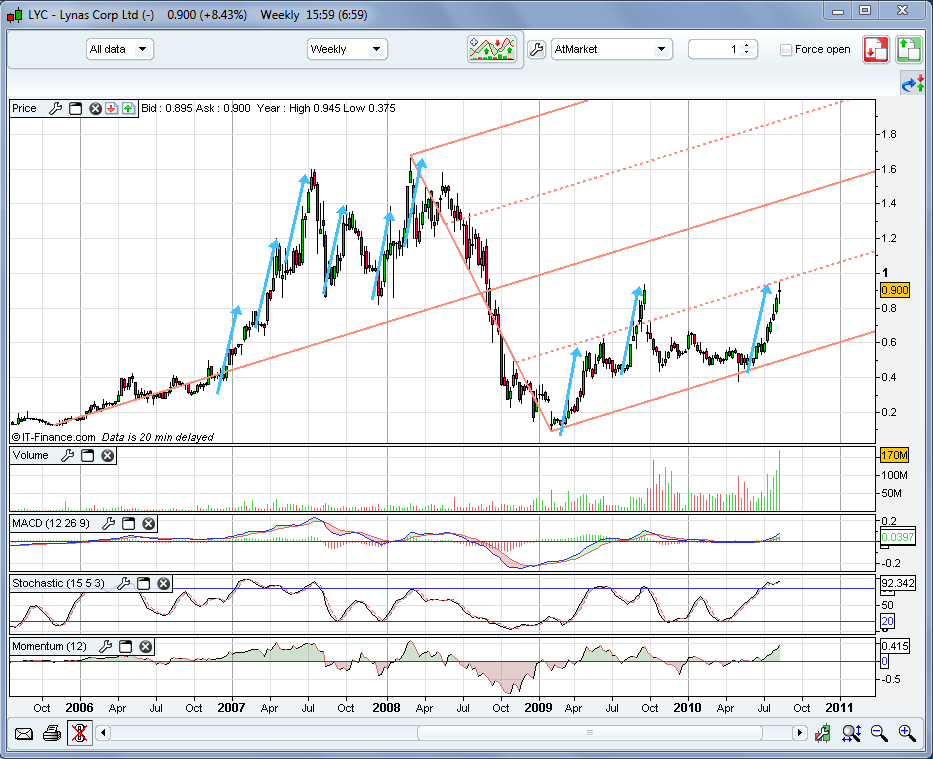
Firstly a larger weekly view guided by an uptrending pitchfork and many repeating ranges, the latest of which seems to have completed.
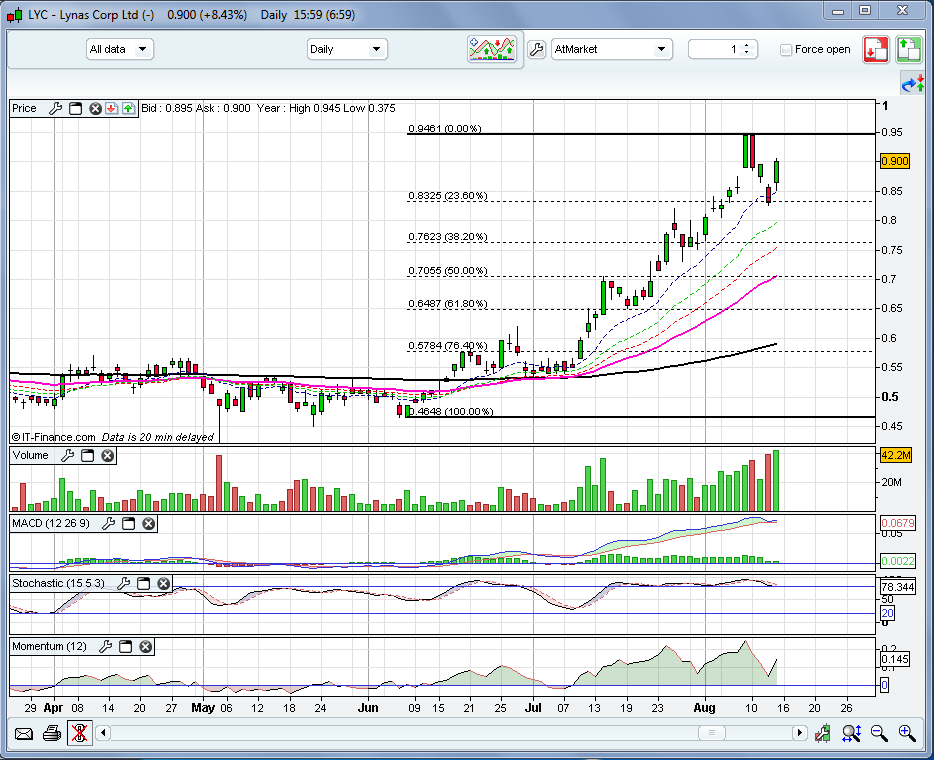
The second chart shows the short term view and the latest move that was accompanied with good volumes.
Fibs and EMAs are there to observe the pullback which may have only gone back to the first Fib line.
If it was to get past 95c then I'd be drawing in another blue range arrow.
- Forums
- Charts
- >>weekend charts - 14/15 august<<
>>weekend charts - 14/15 august<<, page-84
-
- There are more pages in this discussion • 29 more messages in this thread...
You’re viewing a single post only. To view the entire thread just sign in or Join Now (FREE)


