
XJO fell this week, -1.07%. XJO is close to falling into correction territory, down ~9% since its high on 27 July.
SP500 in America fell -2.53%. SP500 is now in correction territory having fallen ~11% since its high on 27 July.
Interest rate policies here and in the U.S. are the major factors affecting the direction of the stock markets, but the geo-political events in Ukraine and the Middle East complicate and deepen bearish sentiment.
The Oz market was down three out of five days, one of those days (Wednesday) was only barely down -0.04%. The American market (SP500) was down four out of five days.
XJO is now -5.05% below its 200-Day SMA - well into bearish territory. SP500 is -2.36% below its 200-Day SMA. Such conditions assume the best trading strategy is to sell any rallies. We are, however, into a bullish seasonal time, so the received "wisdom" might be taken advisedly.
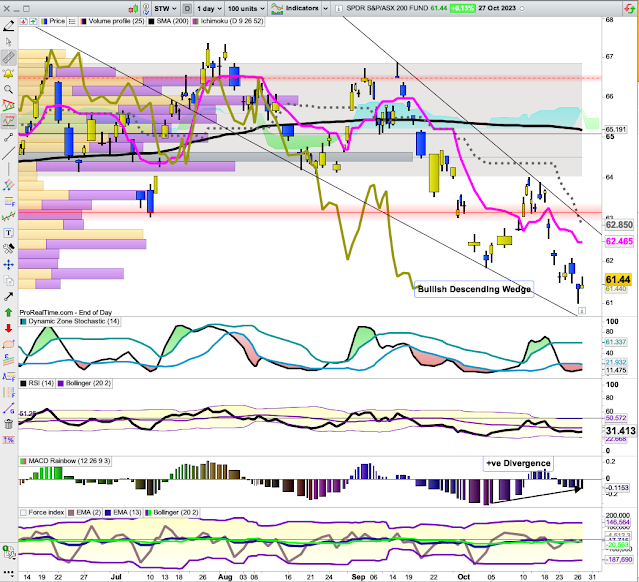
STW Daily Chart (STW is an ETF which tracks the XJO)
STW is setting up for a swing higher rally. It is showing a Bullish Falling Wedge which has a reasonably reliable record. MACD Histogram is showing a strong positive divergence as is the 3-Day EMA of the Force Index.
Look first for a cross by the Dynamic Zone Stochastic above its lower band and then a move by the Chart above the oblique restraining line of the Descending Wedge.
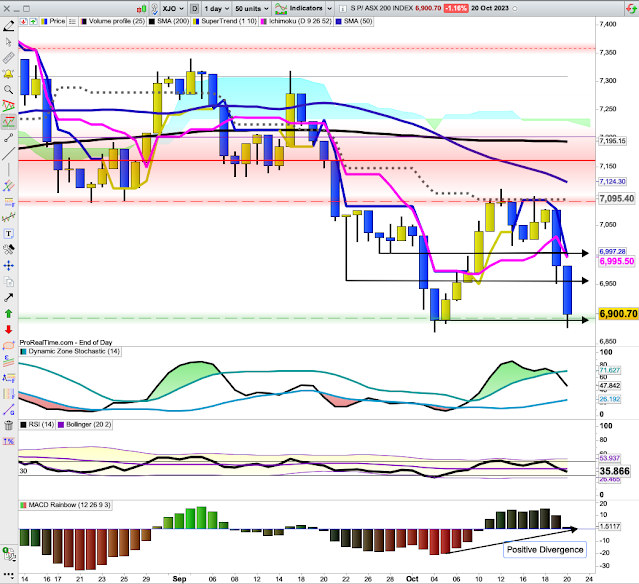
XJO Daily Chart.
XJO held up reasonably well for the first three days of the week, but sliced through important support t 7000 (round numbers) on Thursday. On Friday, it continued down through the next support at 6957 to finish at the next important support of 6900.
Positive divergence on the MACD Histogram suggests the next move will be to the upside.
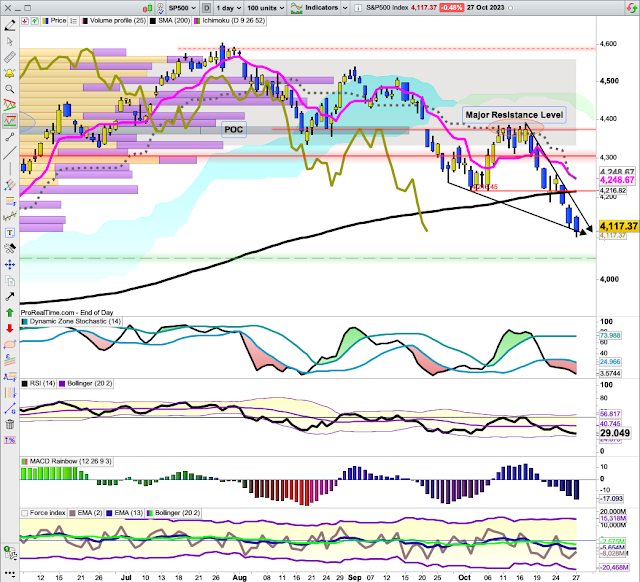
SP500 Daily
SP500 also shows a Bullish Descending Wedge.
The Index has closed in a relatively low volume zone which might be tempting for bullish traders to enter trades and push the Index to the upside. A major resistance zone at the top of the wedge might proved a difficult level to overcome as it coincides with the Point of Control (heavy volume) on the Volume
Profile over on the left of the chart.
A horizontal resistance level also lies at around 4217 which coincides with the 200-Day MA - so that may also prove to be a difficult first level to overcome.
The next Federal Reserve (U.S.) meeting is a two-day meeting on 31 October/1 November. That may be a catalyst for a significant market move.
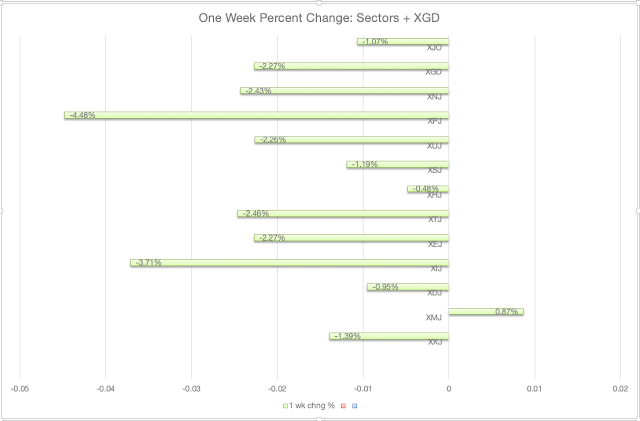
Sector Performances this week.
The place to be this week was in Materials, esp. the big miners. XMJ up +0.87%. That was the only positive sector.
The worst performing sector was the interest rate sensive Property (XPJ) -4.48%. IT, another interest rate sensitive sector, was down -3.71%.
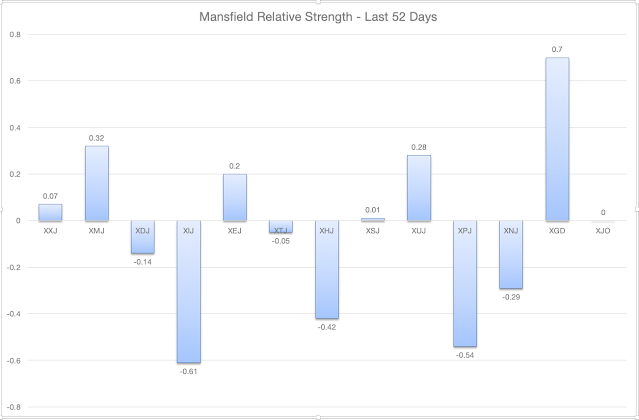
One Week data can be volatile and not necessarily give a good picture of medium term activity. Mansfield Relative Strength over 52 Days gives a better understand. MRS measures the activity of an Index against the XJO. Above zero is positive and below zero is negative.On this measure, Materials (XMJ) continues to win out, but several other sectors are also positive: Financials (XXJ) Energy (XEJ), Staples (XSJ), and Utilities (XUJ).IT (XIJ) and Property (XPJ) remain the worst performers over this longer term.100 Leader Stocks above their 200-Day, 50-Day and 10-Day Moving Averages.
The last time we saw only12% of stocks above their 50-DMA was back in September, 2022 - over 12 months ago.
- Above their 200-DMA: last week 32%, this week 34%.
- Above their 50-DMA: last week 21%, this week 12%
- Above their 10-DMA: last week 19%, this week 19%.
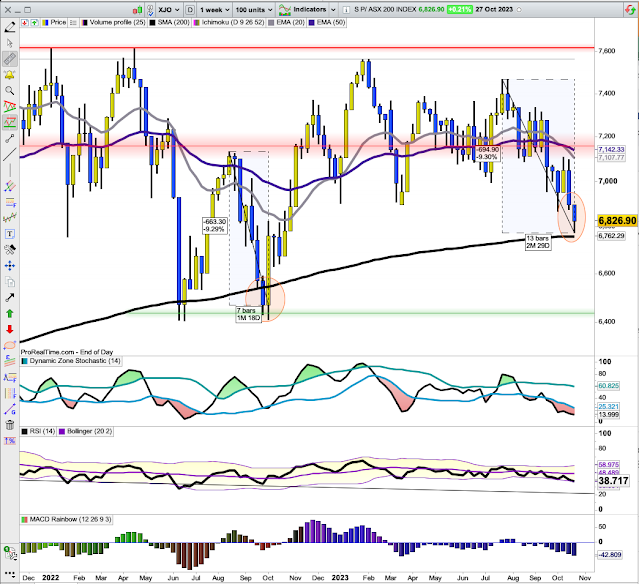
I've marked that time on a weekly chart of XJO below:
Sept. 2022 also marked a test of the 200-Day MA. XJO is currently in a similar situation now. The fall in 2022 is also similar in magnitude to the current fall, about 9%. The 2022 fall took a short time, however, than the current fall - 7 Trading Days compared to 13 Trading Days for the current fall.Given the poor performance ot the American market on Friday night, it seems likely that XJO will hit the 200DMA on Monday. Watch for a rebound sometime in the middle of the week - hopefully after the Federal Reserve Interest Rate decision (Wed. night Oz time.)Conclusion.The Australian market has been falling heavily and is almost into correction territory (down >10%).Signs exist which provide some optimism, but price action is always the final arbiter. Watch for XJO to break above oblique restraining line of the Descending Wedge marked on the Daily Chart.
23/10 Indices, page-227


Add XJO (ASX) to my watchlist
 (20min delay) (20min delay)
|
|||||
|
Last
8,176.9 |
Change
-28.500(0.35%) |
Mkt cap ! n/a | |||
| Open | High | Low |
| 8,205.4 | 8,223.5 | 8,164.8 |
| XJO (ASX) Chart |