OK,By50 is going to let you all in on a secret, my trading friends say I'm being too generous and I should'nt do it.But BY50 inspite of going on the occasional rant when by50 and gets cranky about people trying to force opinions because there got some emotional set to there position in the market.
Now I mentioned reference points last week, and gave a bref outline how I get them, well I had a think about it and my way is possibly to too much work.
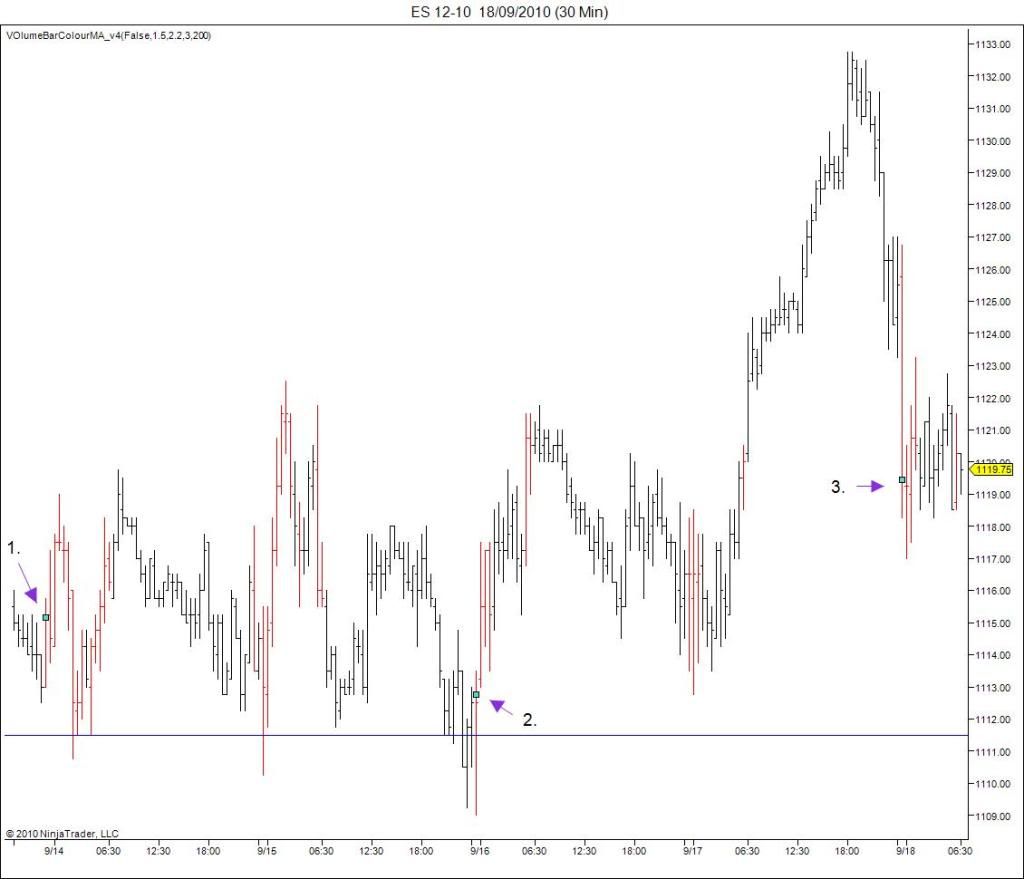
So here's a simple way of doing it.ON the frist chart I have done it as an example.
And that is mark the closing price of the opening bar of the day every 3 days.
But why I hear you ask , well I'm going to tell you.I go on about noise around the market and how most of the oppionions are allready in the price , the reference points give you a picture of where the market has been in relation to where it is now.Kind of a trend indicator.But not only that they tell you the condition of the market.
How ??? let me explain; we know that the big commercial traders , like mining companies,financial institutions , and large brokers all trade in big lots , they have deep pockets and are in the market for a bigger percentage gain than speculators. They move the markets !
Industry knowlege goes into the market long before information is released into the general community.You won't find it out from CNBC or any other jibber vendor untill its already set.
The big guys don't have to trade every day , they pick when and where they trade ..but they genrally do it into high liquidity , e.i ..in the open and closing parts of the day.
Now I often say you dont know how many sheep you have in the paddock untill you put them in the yards and count them.
The reference points...they are the yards that hold the numbers.
On chart one I have marked them at the closing price of the opening bar of the day ;;every 3 days on a 30 min chart. my software also highlights the bars that have higher than average volume, this data set is during the roll over period where volume is usually higher , but that dosents matter that much you can get the drift.
Now in this chart the marks a not showing much trend , mark 3. is a little higher than mark 1.which means there has been some buying but it hasent amounted to much.So the condition of this market right now in generall is horozontal.. and you can see that it attemped to break out upside but the horozontal nature of the market pulled it back.
This is a warning that it is possible the trend may change , I am still happy to aproach it from the buy side but if it starts to break down below mark 1. it's very possible it will break the bottom of the range and we will have a change in sentiment, and therefore the best aprocah will be to trade from the short side.That will become clear in few days.
Now , trend lines , ossilators , cycles, elliot waves , macd's . mavs are all good ,and they can be traded , but they won't tell you the condition of the market like these reference points will.
you can never be sure which way the volume is set untill after the fact .
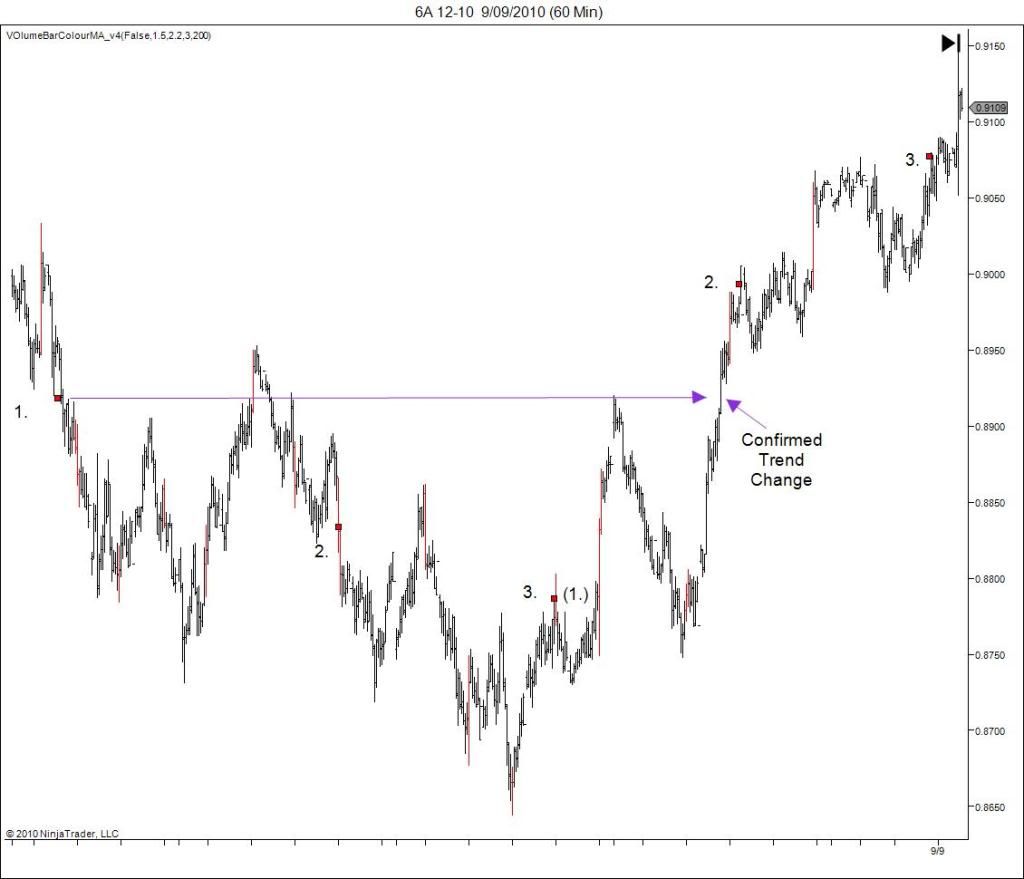
Chart 2. is not current but I am putting it up here as an example.It's the A$ but it could just as easily be the XJO during march 2009.
I had'nt been on HC that long at that point and I had a few blowups with a few people on here at the time ...they where calling a buy when the market looked like the first 1.and 2. sections on this chart. One of them had the hide to pull me up on it 12 months later.The market was a dangerous place back then , and being a public forum I consided it more sensible to wait for a trend change before shouting buy buy buy ..you can never know what kind of risks inexperienced people could take..well in that case it turned out alright...but if it had'nt ..people could have lost alot of money.AT point 3 on this chart it is still wise to play it from the long side , the big guys are long here .Now you can uses your macd's ossillators . trend lines ect ect.. to get set knowing that the long side is the right play as the generall market is long.The refrence points will give you a guide ....thats GUIDE !! to how the big volume is set in the market and it is best to trade with it .I hope this helps some people trying to understand how markets work and how to read them correctly.The important thing is the relationship between 1. and 3.
As time moves on obiously 2. becomes 1. as 3. moves foward.
hvae a nice weekend.

Add to My Watchlist
What is My Watchlist?


