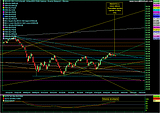
Here is my simple take (as always) on the DJIA, unlike another chart on this thread my chart indicates the price on the DOW closed tucked under a very heavy resistance trendline which has been the target imo. With the target reached will we see an anticipated pullback/consolidation or will it be a bull trap that has a false breakout? I note the volume on Friday night was very low also. The weekly stochastic has also just touched the overbought line.
DJIA 6 month daily with daily slow stochastic
I am waiting for tomorrow's close to get a better idea as imo our big money are pretty handy at picking the US direction (most of the time). Imo watch for a close above Thursdays close of 4633 which will create a higher swing low. I know 4633 is only 32 points above Fridays close but I am anticipating a sell off after an initial target of 4670 is hit. Lets see how it unfolds.. What is also interesting on the XJO is a golden cross set up in the making (not on the chart below). Not sure this means too much these days as current price is above the price when the "death cross' took place.