OZL
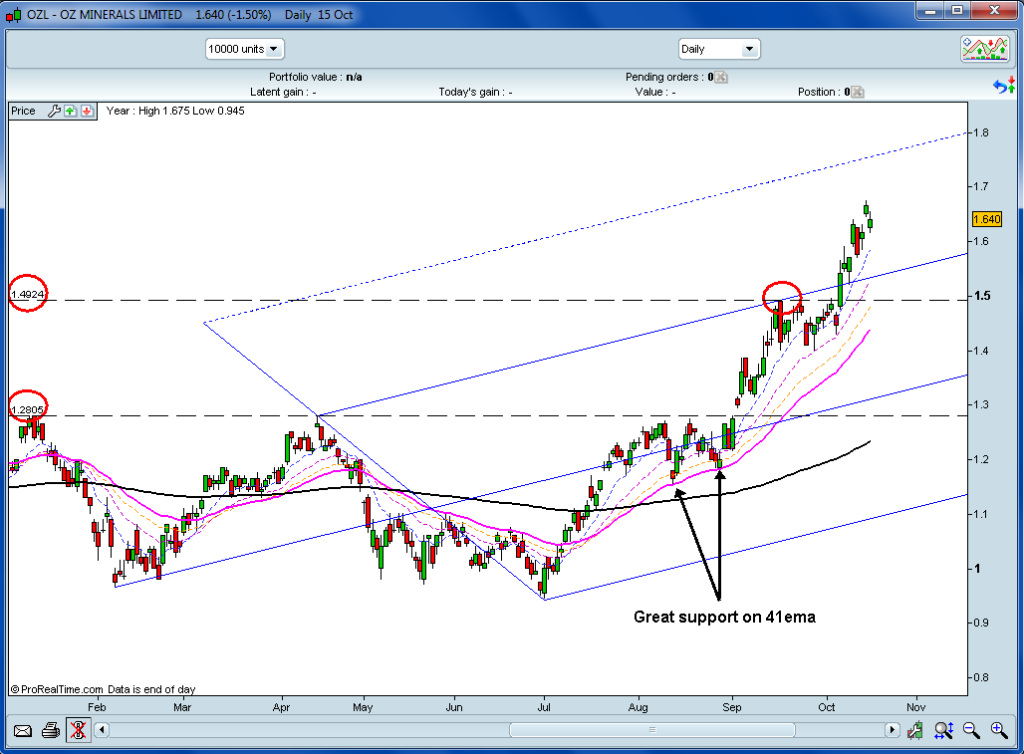
This chart should be looked at as simply as possible: it's going up.
Notable point: found it difficult to break resistance at 1.28 but in the end did so with a gap and hasn't looked back.
The same can be said for the 1.50 area but instead of a gap it did it with a huge green candle.
The 1.50 should provide the support for a healthy pullback as should the smaller moving averages. However instead of pulling back it has formed consolidation rectangles under the resistance lines lately.
I've drawn a faint pitchfork which provided resistance once and after breaking gave support for a retest on the second session after breaking through. In the absence of downtrending lines I've included a 1st warning line (dotted) that may suggest resistance.
Ultimately, look at the shorter term moving averages as dynamic support. As long as price remains above them all is good.
- Forums
- Charts
- weekend charting oct 15217
weekend charting oct 15217, page-61
Featured News
Featured News
The Watchlist
HAR
HARANGA RESOURCES LIMITED.
Peter Batten, MD
Peter Batten
MD
Previous Video
Next Video
SPONSORED BY The Market Online


