MHM
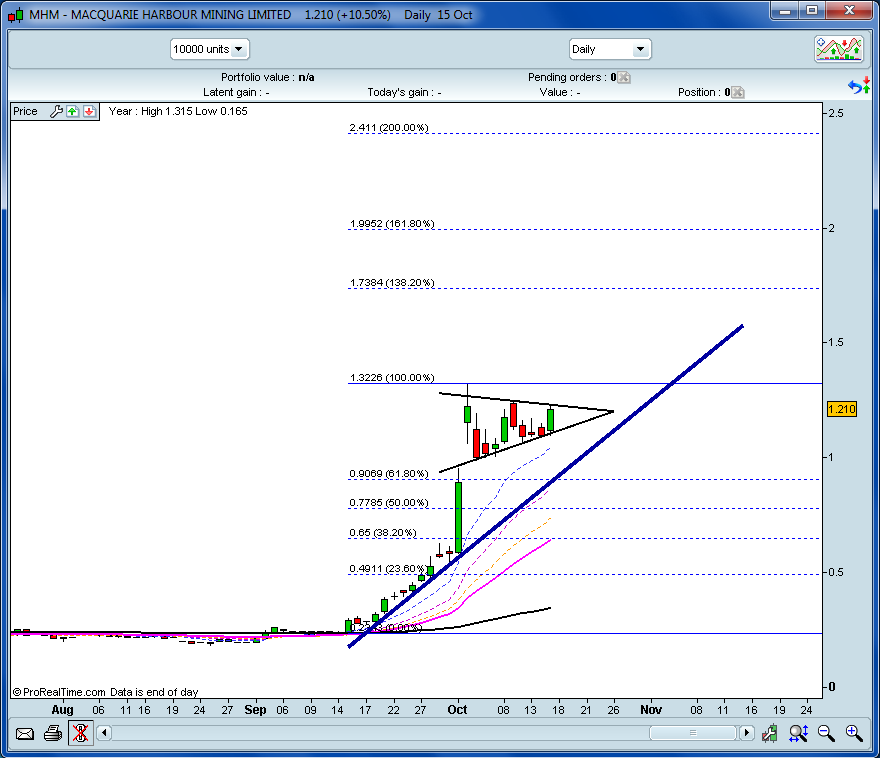
What a huge move! Puts indicators out of the equation as they all tell you overbought.
So we look for a trendline. There's one there in bold blue - that'll be the KEY support line. 61.8% and 38.2% lines look to be the better of the supports should it break down.
There is a pennant that's formed which is usually a continuation pattern - should break up but doesn't have to. Best to wait and see now.
Lastly, fibonacci projections to look for future targets if/when it makes a new high.
A five bagger already. TA says hold. I know FA about FA.
- Forums
- Charts
- weekend charting oct 15217
weekend charting oct 15217, page-63
Featured News
Featured News
The Watchlist
CC9
CHARIOT CORPORATION LTD
Shanthar Pathmanathan, MD
Shanthar Pathmanathan
MD
Previous Video
Next Video
SPONSORED BY The Market Online


