Morning XJO fans.
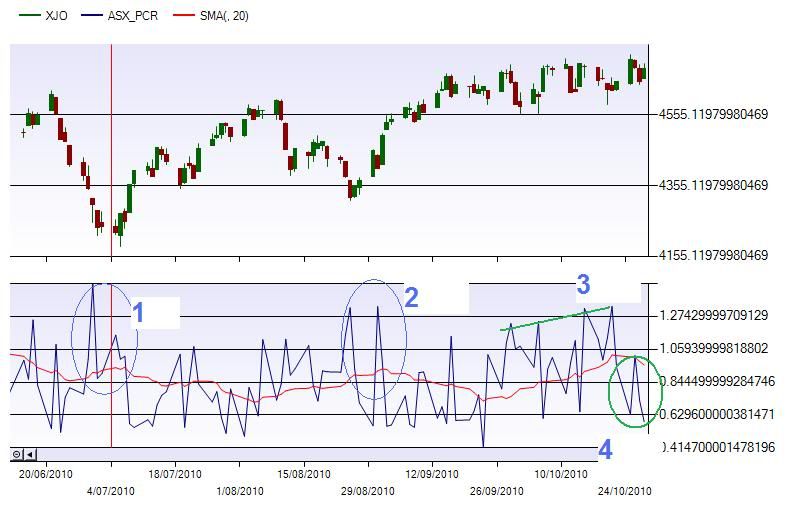
I thought I'd post a follow up chart on the ASX put call chart I posted early this week, as the dynamics have changed. So here is the chart with comments to follow...
I have marked off at points 1 & 2 previous points where the puts (shorts) have gotten overextended to mark out a low on the XJO. This is the normal pattern for the PCR, as well as the PCR calls (longs) getting overextended as the PCR bottoms typically mark out tops on the XJO.
So for todays chart I put in each days PCR reading as well as the 20-day SMA.
I commented earlier in the week how it was out of order, which is point 3. The PCR was getting high enough to be marking out a low, but the XJO was grinding higher hence the conflict. So, either the market had to rally, or the PCR had to correct back down.
Point 4 shows how this weeks action has seemed to flush out alot of shorts, to give us that correction. So, we are still within our trading range, but the PCR is now falling and could now potentially be getting set to mark out an XJO top.
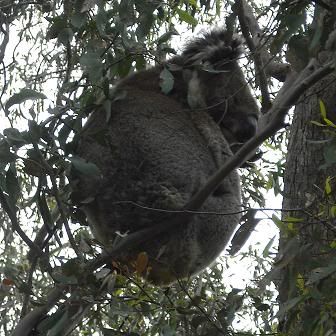
Heres a piccy of a visitor we had last night. Its a huge bugger of a koala, and I'm always amazed how they can get comfortable enough to sleep on such a thin wispy branch rolling around in the wind.

- Forums
- ASX - By Stock
- XJO
- can't believe it's friday!
can't believe it's friday!, page-3
-
- There are more pages in this discussion • 36 more messages in this thread...
You’re viewing a single post only. To view the entire thread just sign in or Join Now (FREE)
Featured News
Add XJO (ASX) to my watchlist
 (20min delay) (20min delay)
|
|||||
|
Last
8,075.7 |
Change
87.800(1.10%) |
Mkt cap ! n/a | |||
| Open | High | Low |
| 7,987.9 | 8,079.0 | 7,979.5 |
Featured News
| XJO (ASX) Chart |


