Hi Folks
I keep thanking the great contributors here on the SSN thread who do a great job in providing all the in depth fundamental news/info re Bakken and Niobrara drilling developments. SSN's fundamentals speaks for itself I think, and I for one continue to find encouragement in that news.
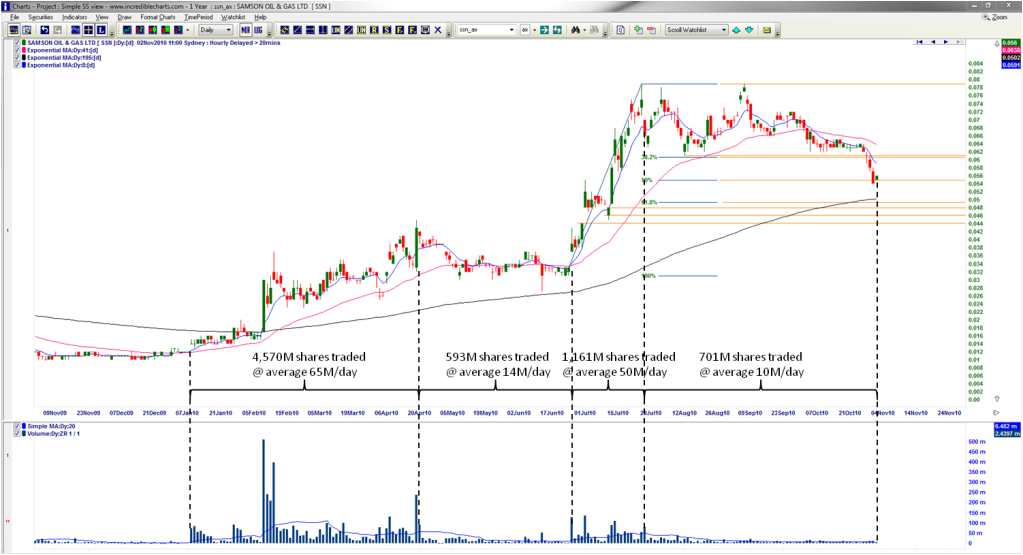
But nevertheless there's clearly a few nervous people here. I cant add anything to the great fundamental research but I can provide a picture that adds another perspective. That perspective is of how much buying and selling has actually been going on.
If you have a look at the following SSN chart, you can see I've broken the chart over the last 10 months into four stages - two stages which saw significant price growth, and two consolidation phases. Have a look at the trading volumes associated with each. The two growth stages are characterised by high volumes, the two consolidation stages by low volumes.
This picture provides me with one simple message: most of those who bought during the growth stages have not sold during the consolidation stages.
Sure there's higher trading activity & churn during the growth stages as traders take advantage, probably several times, but the total shares transacted during the growth stages are 5,731M shares versus 1,294M shares during the consolidation stages, a ratio of almost 5:1.
The price drop on small volumes is not bad news. A price drop in big volumes would be. At a rate of 10M shares a day, what's happening at the moment is "leakage" as some investors "at the margin", i.e. those who got in later in the game either protect their cash positions or those who were the next to last are being forced to take profits before their positions go into the red.
Hopefully this picture provides some extra perspective about how many traders/investors are actually selling, but certainly review all the detailed fundamentals that many here are sharing to understand why it looks like most people are actually hanging onto their shares.
Cheers, Sharks.
Add to My Watchlist
What is My Watchlist?


