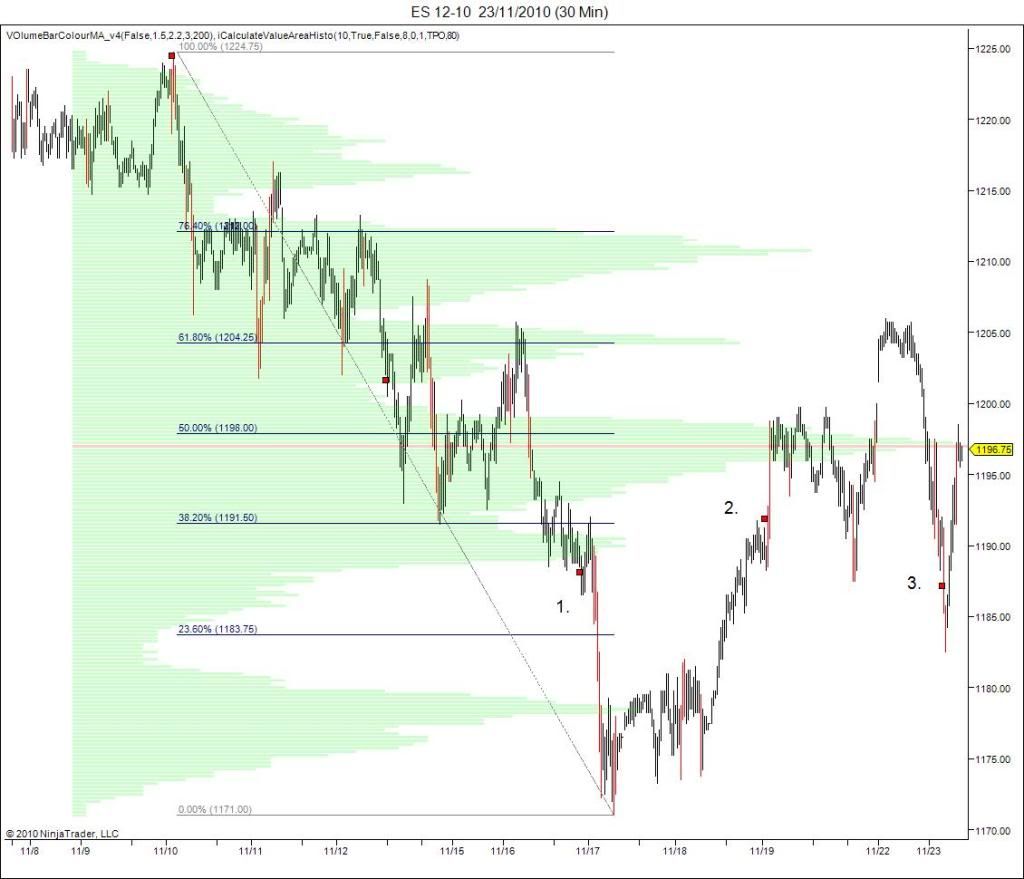
This chart is the leader the emini SP500 ...I'm posting it to show a very close relationship between the bell curve,profile (overlayed) and the Fib levels..
It's also intresting the center of the curve , with the most traded levels for the range (value) is almost right on the 50% fib level.
But probably of more importance here is the reference points ..we posted another one last night , now showing the relationship between ref-point 1. and 3. is almost equal , giving us a market that is captured by horozontal development.
Also on a daily basis my data shows that the opening and closing prices for this market have been almost the same for the past 3 .5 sessions..which further enforces the reference points showing the horozontal condition of this market ..That means the way to trade it is to sell above the value and 50% retrace line and buy below it untill you are wrong.good luck.
- Forums
- ASX - By Stock
- XJO
- u2 tuesday
XJO
s&p/asx 200
Add to My Watchlist
0.07%
 !
8,574.4
u2 tuesday, page-2
Featured News
Add to My Watchlist
What is My Watchlist?
A personalised tool to help users track selected stocks. Delivering real-time notifications on price updates, announcements, and performance stats on each to help make informed investment decisions.
 (20min delay) (20min delay)
|
|||||
|
Last
8,574.4 |
Change
-5.700(0.07%) |
Mkt cap ! n/a | |||
| Open | High | Low |
| 8,580.1 | 8,593.6 | 8,558.3 |
Featured News
| XJO (ASX) Chart |
The Watchlist
VMM
VIRIDIS MINING AND MINERALS LIMITED
Rafael Moreno, CEO
Rafael Moreno
CEO
SPONSORED BY The Market Online


