Going to have a ramble for a minute about 'overbought' stochastics and rsi. These are often mentioned as danger signals and probably rightly so, but these charts show another side I think.
This spx is just to show why the current run can continue regardless of the stochastic sitting at around 91.
spx
My xao is pretty much the same thing, but with some more lines. My point is that the warning sign which comes with an overbought momentum indicator could be overstated without further corroboration. The xao seems to have got into a channel which could take it further up, but?
xao
This last chart is my playing around with these indicators to see if there is some way of knowing if you were on a winner while it was in progress. The alignment of the stochastic and the rsi in this example would have done your bank balance some good. Haven't tested this with any other stocks yet so don't take too much notice.
sfr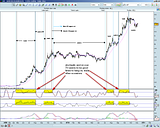
weekend charting 10/12 dec, page-60


Featured News
Featured News
The Watchlist
VMM
VIRIDIS MINING AND MINERALS LIMITED
Rafael Moreno, CEO
Rafael Moreno
CEO
SPONSORED BY The Market Online