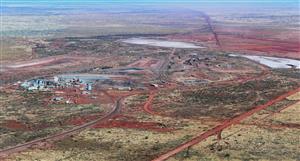
You probably noticed the vertical lines which are regular cycles.
So a severe downturn is more likly at this point or in the next few years than mid cycle.
- Forums
- ASX - By Stock
- XJO
- thursday
XJO
s&p/asx 200
Add to My Watchlist
0.89%
!
8,553.2

thursday, page-29
Featured News
Add to My Watchlist
What is My Watchlist?
A personalised tool to help users track selected stocks. Delivering real-time notifications on price updates, announcements, and performance stats on each to help make informed investment decisions.
|
|||||
Last
8,553.2 |
Change
-77.100(0.89%) |
Mkt cap ! n/a |
Open | High | Low |
8,630.3 | 8,630.3 | 8,544.7 |
Featured News
XJO (ASX) Chart |
The Watchlist
WCE
WEST COAST SILVER LIMITED
Bruce Garlick, Executive Chairman
Bruce Garlick
Executive Chairman
Previous Video
Next Video
SPONSORED BY The Market Online