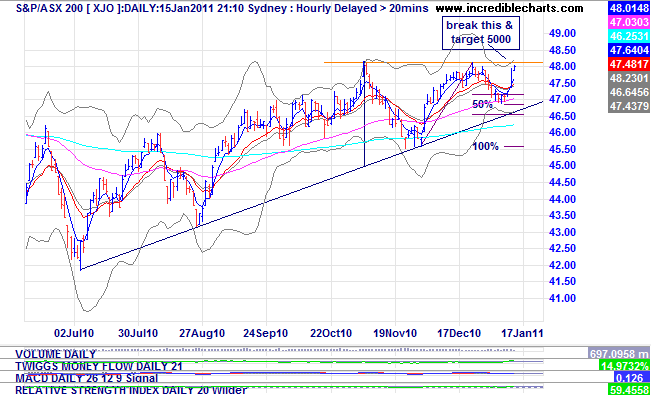
This chart suggests the XJO in the short term will head higher. There is an ascending triangle present, the fib retracement of 50% has been respected along with the 200 day moving average. RSI at 60 gives room for upward movement and the MACD has a bullish cross. When the 4810-4815 resistance breaks a possible target of 5000 which is the next level of resistance is not out of the realms of possibility, just my opinion.
- Forums
- ASX - By Stock
- XJO
- a few charts of interest
a few charts of interest, page-16
-
- There are more pages in this discussion • 30 more messages in this thread...
You’re viewing a single post only. To view the entire thread just sign in or Join Now (FREE)
Featured News
Add XJO (ASX) to my watchlist
 (20min delay) (20min delay)
|
|||||
|
Last
8,091.9 |
Change
46.800(0.58%) |
Mkt cap ! n/a | |||
| Open | High | Low |
| 8,045.1 | 8,091.9 | 8,045.1 |
Featured News
| XJO (ASX) Chart |
The Watchlist
CCO
THE CALMER CO INTERNATIONAL LIMITED
Anthony Noble, MD & CEO
Anthony Noble
MD & CEO
Previous Video
Next Video
SPONSORED BY The Market Online


