Gday gurus, masters and lords of the XJO.
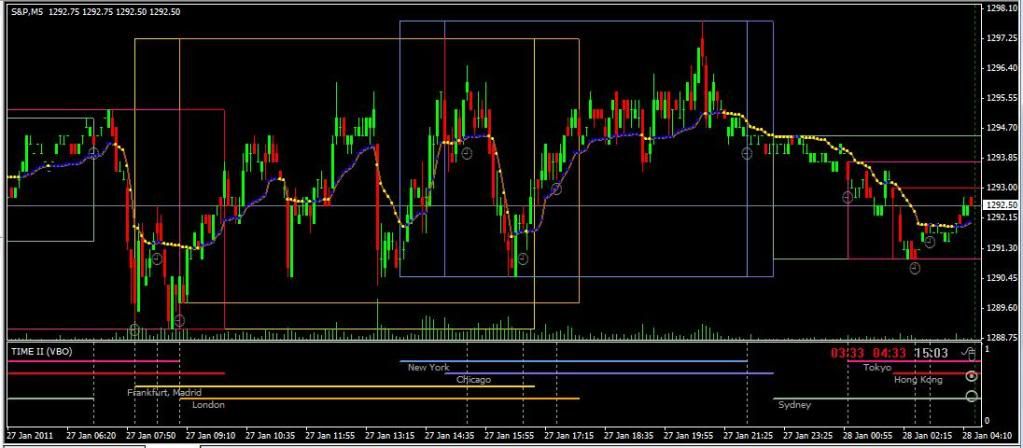
So looking in weeks to come, I think the commodities space will drag the equities down a bit more significantly from here. The US markets are still trying to rally but metals, and now oil are falling, shows where the bernanke bubble is blowing. The intraday action on US markets had a bit of a spike that could be a potential top, which is my first chart...

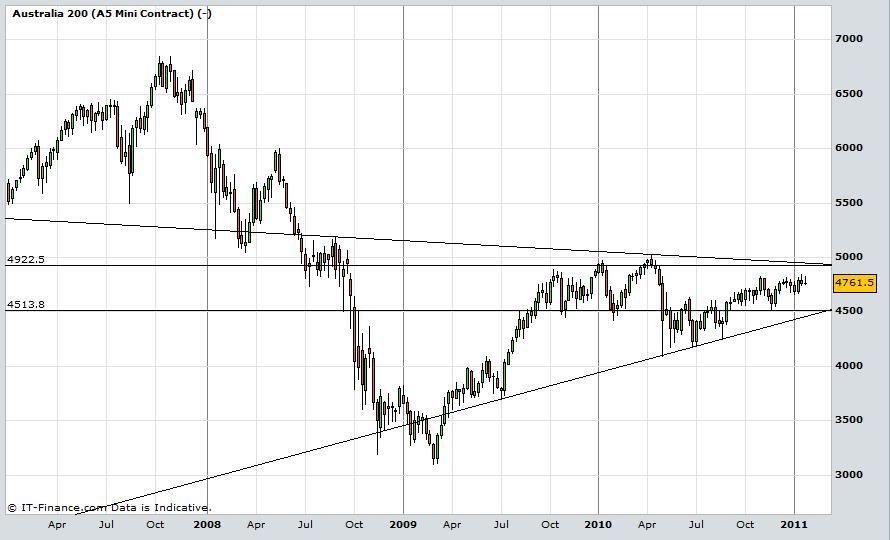
My bias downwards from here, may lead to a bullish outlook moving a couple months forward, which leads to my weekly chart below. I believe the metals selloff could lead us down to 4500 area, from where a new uptrend could begin, and we can start looking for a break of 5000 around April?

- Forums
- ASX - By Stock
- XJO
- friday trading
friday trading, page-25
-
- There are more pages in this discussion • 19 more messages in this thread...
You’re viewing a single post only. To view the entire thread just sign in or Join Now (FREE)
Featured News
Add XJO (ASX) to my watchlist
 (20min delay) (20min delay)
|
|||||
|
Last
7,921.3 |
Change
60.100(0.76%) |
Mkt cap ! n/a | |||
| Open | High | Low |
| 7,861.2 | 7,938.3 | 7,861.2 |
Featured News
| XJO (ASX) Chart |


