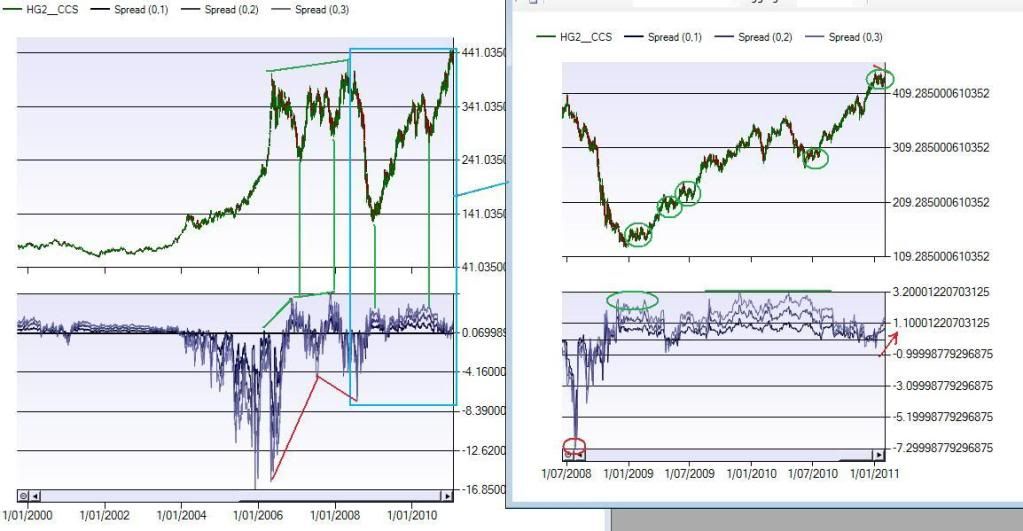
Anferni, just looking at the triple top on copper as I read your post, could go either way really. Perhaps we should ask ol JGil what she knows about copper tops?
Alot of bullishness in the energy sector. Made a few points shorting the gap yesterday on oil, but should have gone long on the gap close, many more points on the long side.
As for PM's volatility seems to be falling, price nudging up. I suppose the range is between 1307 and 1350 gold, 2650 and 2850 silver, may chop around a bit here. Like copper could go either way.
Looking at the spread charts on copper, I notice the triple top pre GFC was actually over 2 years, not 4 months. 3 tops on hourly? I could probably argue either way for copper based on the spread charts. Except for the fact that it ended badly on the 2 year triple top, it does look bullish when comparing triple moves in the last 2 years like the green circles on RHS chart.
Just noticed the 4 month triple top also, was the 2nd of 3 tops from the 2 year TT. Its shaped more like our current hourly one, and the next pullback wasn't real severe, but enough to go from 378 top to 285 low. Perhaps a small pullback off the triple top for a wave 4 correction, then begins a 5th wave from the mid 2010 low, and same can be said for early 2009 low - 4th of 5 wave to come?

- Forums
- ASX - By Stock
- XJO
- tuesday trading!
tuesday trading!, page-28
-
- There are more pages in this discussion • 18 more messages in this thread...
You’re viewing a single post only. To view the entire thread just sign in or Join Now (FREE)
Featured News
Add XJO (ASX) to my watchlist
 (20min delay) (20min delay)
|
|||||
|
Last
7,943.2 |
Change
-171.500(2.11%) |
Mkt cap ! n/a | |||
| Open | High | Low |
| 8,114.7 | 8,114.7 | 7,920.0 |
Featured News
| XJO (ASX) Chart |


