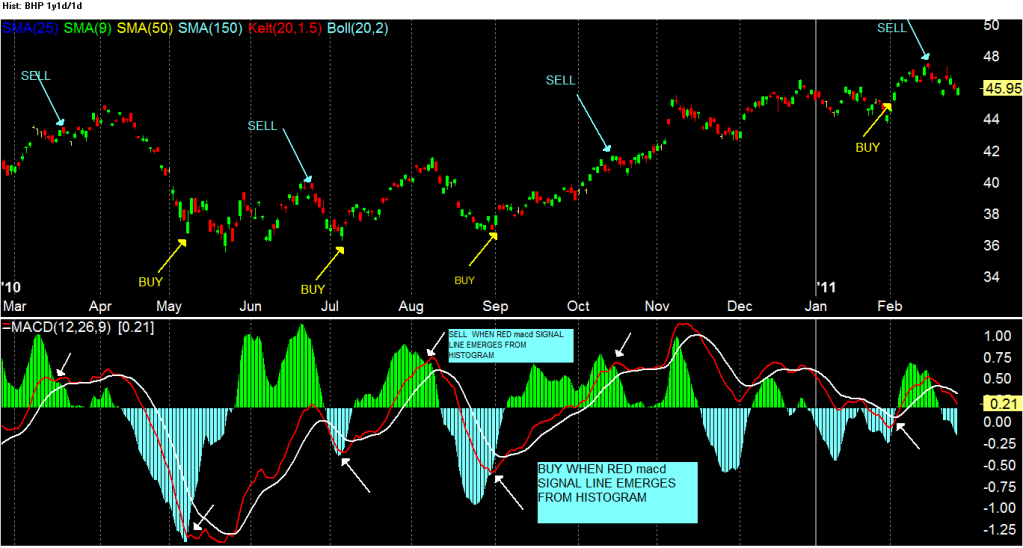
Here's another system which I've seen on a blog...
It's a variation of the theme buy on stochastic crosses north or MACD crosses north.....sell when they cross south.
The above method often causes whipsaws and can be downright dangerous in long oversold markets.
With this system, buy when the MACD red signal line emerges from the negative hisrogram...sell when it emerges from the positive one--shown by white arrows.
Having a Stochastic there (not shown) helps confirm the move.
Chart is for BHP.
- Forums
- ASX - By Stock
- XJO
- weekend charts
weekend charts, page-24
-
-
- There are more pages in this discussion • 29 more messages in this thread...
You’re viewing a single post only. To view the entire thread just sign in or Join Now (FREE)
Featured News
Add XJO (ASX) to my watchlist
 (20min delay) (20min delay)
|
|||||
|
Last
7,767.5 |
Change
7.900(0.10%) |
Mkt cap ! n/a | |||
| Open | High | Low |
| 7,759.6 | 7,819.0 | 7,754.9 |
Featured News
| XJO (ASX) Chart |
The Watchlist
LU7
LITHIUM UNIVERSE LIMITED
Alex Hanly, CEO
Alex Hanly
CEO
SPONSORED BY The Market Online


