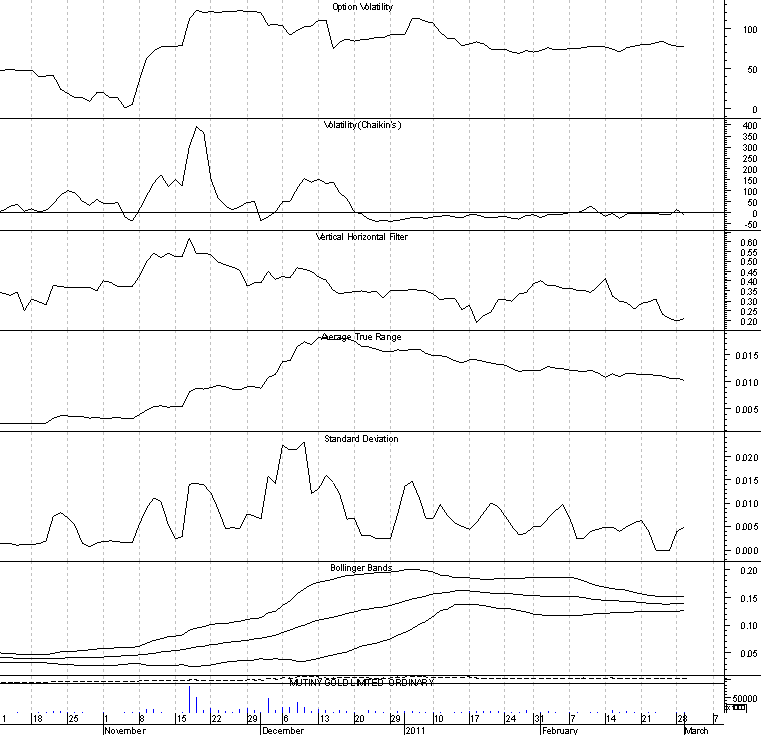
Its all about Volume and Price and we dont have volume...
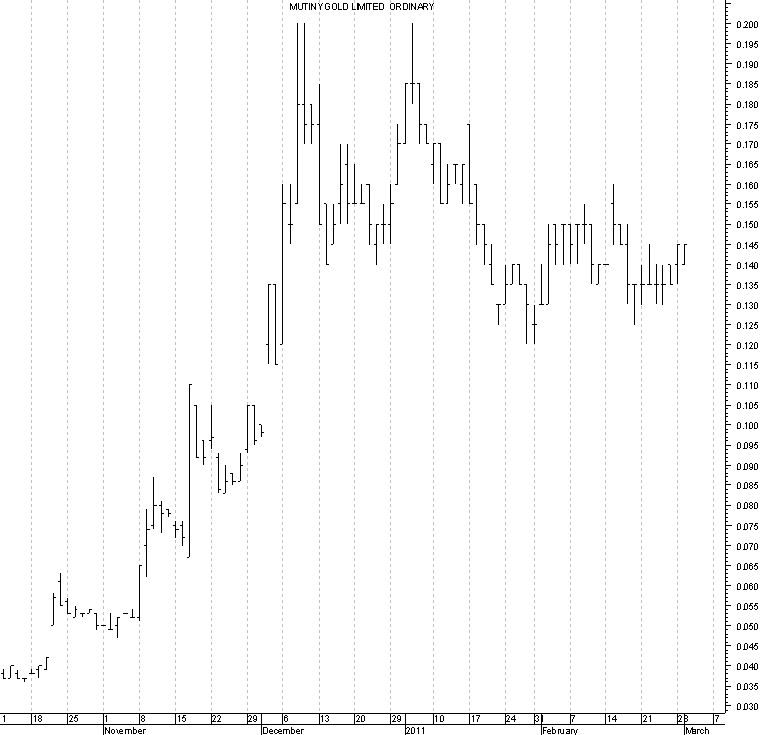
The average punter paid 14c in the past month and thats why this is narrowing as the point of technical procrastination.
125 is the support and 16 the resistance.. the last attack at the resistance required 3.9 times the average volume on feb 15 and that failed....
We can show a current bullish MACD Buy Trigger but that is only half the story..the lower charts show no volatility/momentum and thats because there is no volume driving it...
The longer the accumulation the bigger the break and thats what the bollingers tell us....which way it will break depends on you fundamentalists...lol
- Forums
- ASX - By Stock
- MYG
- chart
chart, page-32
-
- There are more pages in this discussion • 4 more messages in this thread...
You’re viewing a single post only. To view the entire thread just sign in or Join Now (FREE)
Featured News
Add MYG (ASX) to my watchlist
 (20min delay) (20min delay)
|
|||||
|
Last
82.0¢ |
Change
0.000(0.00%) |
Mkt cap ! $75.00M | |||
| Open | High | Low | Value | Volume |
| 82.0¢ | 82.0¢ | 82.0¢ | $6.56K | 8K |
Buyers (Bids)
| No. | Vol. | Price($) |
|---|---|---|
| 1 | 11296 | 75.5¢ |
Sellers (Offers)
| Price($) | Vol. | No. |
|---|---|---|
| 82.0¢ | 12000 | 2 |
View Market Depth
| No. | Vol. | Price($) |
|---|---|---|
| 1 | 11296 | 0.755 |
| 2 | 4408 | 0.750 |
| 2 | 33514 | 0.740 |
| 2 | 22504 | 0.735 |
| 1 | 10000 | 0.730 |
| Price($) | Vol. | No. |
|---|---|---|
| 0.820 | 8000 | 1 |
| 0.830 | 30088 | 1 |
| 0.835 | 6655 | 1 |
| 0.840 | 8000 | 1 |
| 0.850 | 932 | 1 |
| Last trade - 11.08am 14/11/2024 (20 minute delay) ? |
Featured News
| MYG (ASX) Chart |


