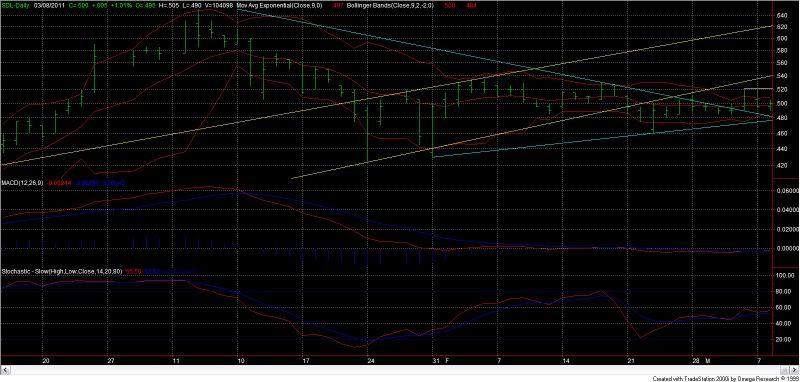
Just another opinion..
Negatives:
The Bollinger Bands are indicating an overbought market.
The parabolic is in bearish territory.
Rate of Change is above zero (5.26), indicating an overbought market.
Based on a 9 bar moving average volatility is in a downtrend.
Volume is trending lower. In general this is bearish.
Volume Average Indicator: The current upward average is not accompanied by any significant volume action, suggesting that the current move lacks broad participation.
Volume ROC suggests a continued sell off is likely.
DMI is in bearish territory.
ADX levels are declining, still suggesting a choppy market ahead.
The long term trend based on a 45 bar moving average is down.
Positives:
The Volume Oscillator suggests a stall or reversal of the current trend. Currently CCC is declining (based on a 14 bar moving average), while the Volume Oscillator is negative, which is somewhat bullish.
TRIX (-2.24) is below zero, indicating an oversold market.
The short term trend based on a 5 bar moving average and a 9 bar MA is up.
A close up of the daily chart shows a double-top formation at 52 cents. (on 04/03/2011 and 07/03/2011)
Resistance at 0.52 (white trend line) must be overcome by the end of the week, or that double-top will be formed on the weekly.
Currently, a breakout above 54/54.5 cents (LT resistance) would insure a better level of support for the future..
Good luck for the rest of the week!
- Forums
- ASX - By Stock
- SDL
- soon will move,no time
soon will move,no time, page-26
-
- There are more pages in this discussion • 13 more messages in this thread...
You’re viewing a single post only. To view the entire thread just sign in or Join Now (FREE)


