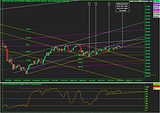
petafemto, it depends I guess, below is a weekly XJO chart, as indicated by the (*) the price has breached the yellow ascending trendline on several occasions (over the last few years) only to finish the week above. I wouldn't expect any different this week IMO. One thing I will say is that if the price closes lower than the trendline on the DAILY (above chart) then it's a different story as this would obviously mean that the weekly line has been breached and then yes the uptrend is broken IMO. If this plays out 4500 (ish) should catch it imo
ps- a bit annoying that the charts aren't as clear after posting. On my screen they are much clearer. Also for anyone wondering, those trendlines have been there for yonks (on my charts) and they are NEVER moved or tweaked.
Weekly
- Forums
- ASX - By Stock
- XJO
- weds wrap
weds wrap, page-18
-
- There are more pages in this discussion • 27 more messages in this thread...
You’re viewing a single post only. To view the entire thread just sign in or Join Now (FREE)
Featured News
Add XJO (ASX) to my watchlist
 (20min delay) (20min delay)
|
|||||
|
Last
8,168.6 |
Change
18.600(0.23%) |
Mkt cap ! n/a | |||
| Open | High | Low |
| 8,150.0 | 8,183.5 | 8,147.5 |
Featured News
| XJO (ASX) Chart |


