The market has done it again !! I just stumbled upon this time fib relationship this morning. The period from the 2009 market low (10/3/2009) to the 2010 low (21/5/2010) is very close to 61.8% of the total time from the 2009 market low to the feb 17th 2011 high. Last year I went into great depth with all sorts of charts showing that the 2010 Jan and April tops both here and in the US coincided exactly with similar fibonacci time divisions.... back then we blamed Kevin Rudds mining tax and Lord knows what else on the international scene for the drastic downturn....and yet the downturns coincided exactly with these type of fib division.....and here we are again a year later telling the same fundamental stories...it's the carbon tax, the US jobless claims...no, it's the middle east oil crisis.....and yet again it all happens again exactly at an important fibonacci point in time.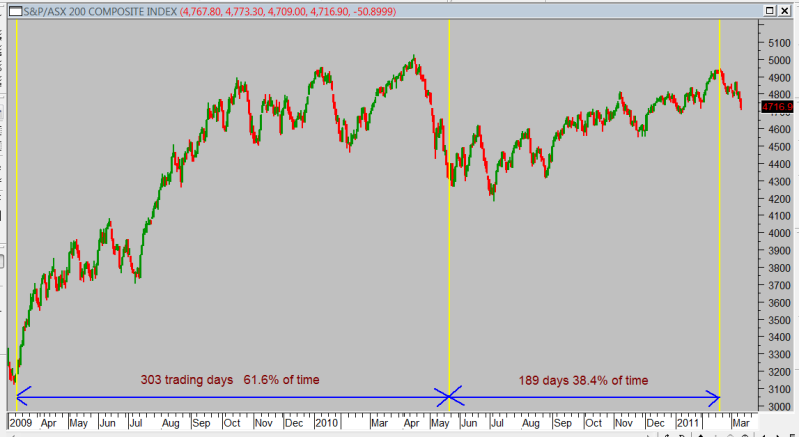


Add to My Watchlist
What is My Watchlist?
 (20min delay) (20min delay)
|
|||||
|
Last
8,630.3 |
Change
59.900(0.70%) |
Mkt cap ! n/a | |||
| Open | High | Low |
| 8,570.4 | 8,632.8 | 8,570.4 |
| XJO (ASX) Chart |