Another on PEN
Positives:
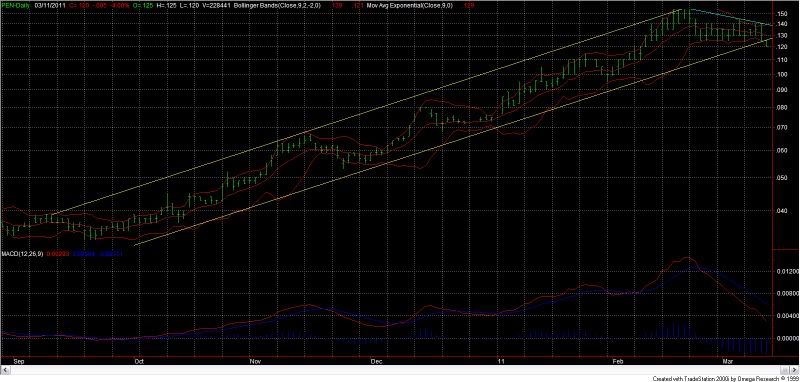
The long term trend based on a 45 bar moving average is up.
On Balance Volume indicates a rally is possible.
%R is in oversold territory
RSI is somewhat oversold. (at 45.58)
TRIX is currently in bullish territory.
Currently PEN is declining (based on a 14 bar MA), while the Volume Oscillator is negative. This is somewhat bullish.
DMI is in bullish territory.
Negatives:
The price is below the linear regression value.
The short term trend based on a 9 bar moving average is down. Momentum is in bearish territory.
PEN came within 0.02 points of reaching the parabolic SAR, showing some strengthening in the downtrend.
Rate of Change is in bearish territory.
The Ultimate Oscillator gives some indication of a continued market selloff.
Based on a 9 bar MA, volatility is in a downtrend.
Volume ROC suggests a continued selloff is likely.
MACD is in bullish territory, however the recent downturn in the average may indicate a short term decline within the next few days.
ADX indicates that the current LT uptrend is weakening and may possibly reverse. A choppy market ahead..
Conclusion:
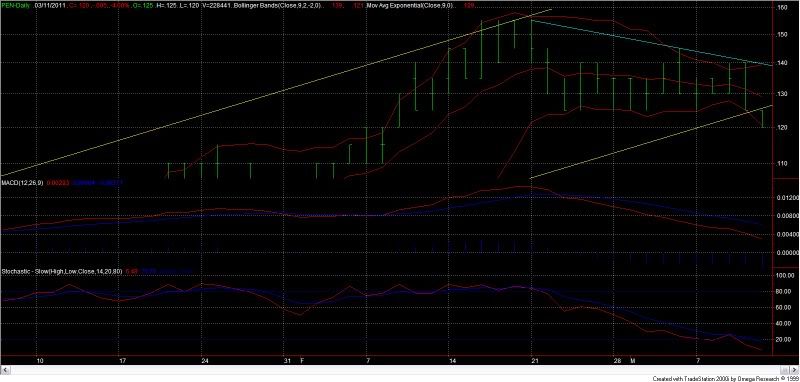
A short term retrace in imminent. Down to which level of support is difficult to pick here. I'd say somewhere in the vicinity of 9 to 10 cents as a rough estimate.
A wise action to take is to wait for a confirmed reversal (as DG specified in one of his valuable comments on TA), rather than getting caught up in a "falling knife syndrome".
Short term resistance is currently at 12.5/13 cents.
The daily chart clearly shows that a breach of support has occurred. It also shows that a double-top formation has formed at 14 cents (09/03/2011 & 10/03/2011) which triggered the reversal.
Daily - zoom view
- Forums
- Charts
- weekend charting thread 12 & 13 march
weekend charting thread 12 & 13 march, page-44
-
- There are more pages in this discussion • 83 more messages in this thread...
You’re viewing a single post only. To view the entire thread just sign in or Join Now (FREE)
Featured News
Featured News
The Watchlist
LU7
LITHIUM UNIVERSE LIMITED
Alex Hanly, CEO
Alex Hanly
CEO
SPONSORED BY The Market Online


