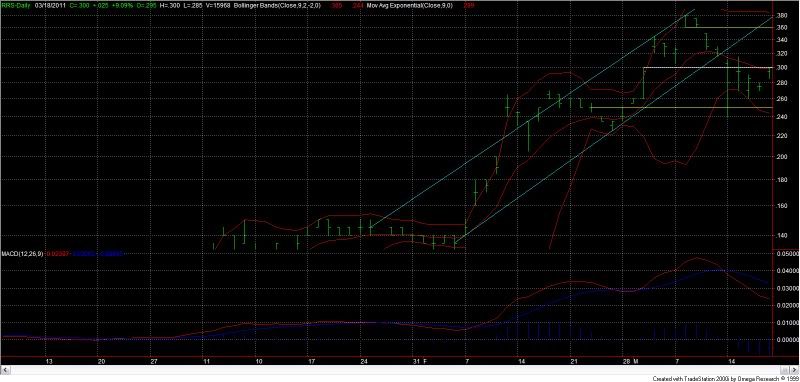
An update to my previous one for RRS
Stochastics and %R are somewhat oversold, but have room to move lower.
DMI has signaled a bullish trade, however the ADX has weakened making it less attractive at the current level
atm..
Average True Range just reached an 18 bar high, offering some evidence that a top is forming here.
The long term trend based on a 45 bar moving average is up.
The short term trend based on a 9 bar moving average is down.
MACD is in bullish territory. However, it indicates a short term decline within the next few bars.
Volume Rate of Change is positive.
Currently RRS is in an uptrend (based on a 14 bar MA), while the Volume Oscillator is negative. This adds some bearish pressure.
TRIX is 224.93, indicating an overbought market condition, while the swing index has crossed over zero, issuing a short term bullish signal.
An observation of the chart shows that the SP has bounced off 24 cents (a cent lower than my prediction:) and closed on that following gap level at 30 last Friday. (white Trend Line)
According to some of the indicators, it may consolidate and get choppy while the gap at 28 cents gets filled perhaps, before the continuation of the uptrend.
35 to 36 cents (upper yellow TL) is a reasonable target to be achieved for the short term imho..
- Forums
- Charts
- weekend charting thread 12 & 13 march
weekend charting thread 12 & 13 march, page-126
-
- There are more pages in this discussion • 1 more message in this thread...
You’re viewing a single post only. To view the entire thread just sign in or Join Now (FREE)
Featured News
Featured News
The Watchlist
LU7
LITHIUM UNIVERSE LIMITED
Alex Hanly, CEO
Alex Hanly
CEO
SPONSORED BY The Market Online


