Dascore, we tend to think linear when it come to time....nice sinusoidal repeating even wave forms.....and yet we will happily use fibonacci ratios with a carefree flick of our hair when it comes to targets in price. So if we use the same fibonacci logic on time then May 21 is very important to the XJO...and as that's a saturday I guess we can take that back to the 20th. 10/3/2009, 11/1/2010 and 15/4/2010 were very important turn dates for the XJO and exact fib ratio time points. I recently put up a similar chart to the one below for the US. Their bear market started 3 weeks earlier than ours and hence their subsequent dates are slightly different to our but again perfect fib time divisions for THEIR time line which in their case will end right on the exact day of the Armstrong low on 13/6/2011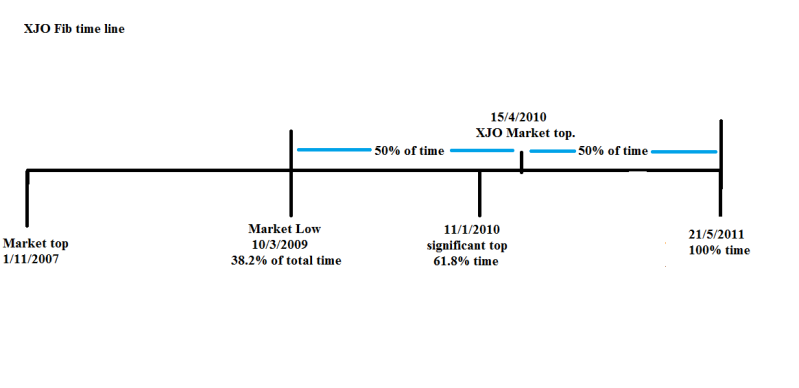
timing by past inferences to present patterns, page-74


Add XJO (ASX) to my watchlist
 (20min delay) (20min delay)
|
|||||
|
Last
7,829.7 |
Change
66.500(0.86%) |
Mkt cap ! n/a | |||
| Open | High | Low |
| 7,763.2 | 7,832.3 | 7,763.2 |
| XJO (ASX) Chart |