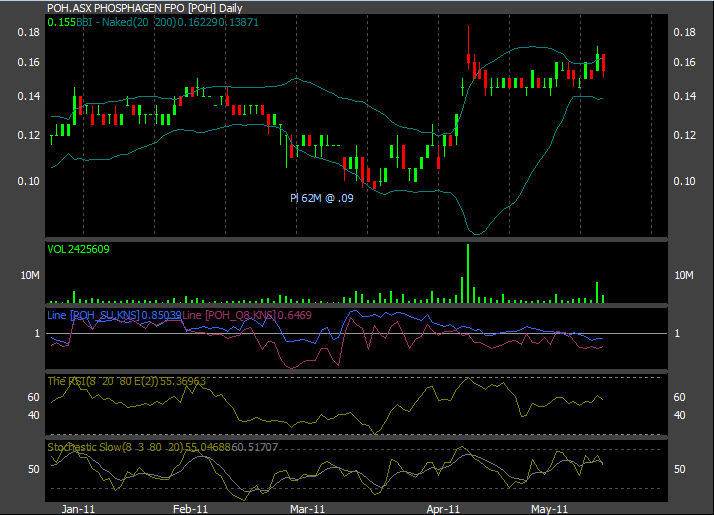
Here's this years price chart.
The interesting indicators are the blue and pink lines - Smart Money and Demand indicators.
When the lines are rising or above the horizontal white line, the buyers are keen.
When the lines are falling or below the white line, the sellers are in control.
It's pretty clear that there has been distribution going on since early April - pretty much since the share price started moving up above the placement price.
Eventually this overhang will run out, and I'm hoping sooner than later.
- Forums
- ASX - By Stock
- AVE
- a current affair, womens day, myer, tvsn:today
a current affair, womens day, myer, tvsn:today, page-66
Featured News
Add AVE (ASX) to my watchlist
 (20min delay) (20min delay)
|
|||||
|
Last
0.3¢ |
Change
0.000(0.00%) |
Mkt cap ! $9.507M | |||
| Open | High | Low | Value | Volume |
| 0.3¢ | 0.3¢ | 0.3¢ | $1.32K | 440K |
Buyers (Bids)
| No. | Vol. | Price($) |
|---|---|---|
| 30 | 40522233 | 0.2¢ |
Sellers (Offers)
| Price($) | Vol. | No. |
|---|---|---|
| 0.3¢ | 40067123 | 32 |
View Market Depth
| No. | Vol. | Price($) |
|---|---|---|
| 31 | 40962233 | 0.002 |
| 32 | 75717741 | 0.001 |
| 0 | 0 | 0.000 |
| 0 | 0 | 0.000 |
| 0 | 0 | 0.000 |
| Price($) | Vol. | No. |
|---|---|---|
| 0.003 | 40508472 | 32 |
| 0.004 | 30346565 | 17 |
| 0.005 | 10575266 | 9 |
| 0.006 | 10908952 | 10 |
| 0.007 | 13396103 | 7 |
| Last trade - 14.05pm 15/11/2024 (20 minute delay) ? |
Featured News
| AVE (ASX) Chart |
The Watchlist
ACW
ACTINOGEN MEDICAL LIMITED
Will Souter, CFO
Will Souter
CFO
Previous Video
Next Video
SPONSORED BY The Market Online


