Fair point ITS. I can't access Ni price/inventory charts going back that far but I have no doubt you are right.
Basic demand/supply dictates that price should be inversely related to inventories. But doesn't work all the time.
Perhaps I should qualify what I say to the effect that sometimes inventories increase because of speculative hoarding/stockpiling even as price goes up and sometimes inventories go down due to speculative stockpiles being dumped even as prices go down in anticipation of even lower prices.
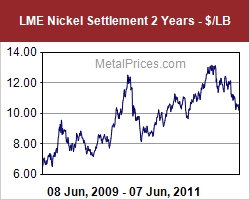
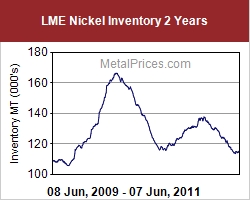
Check out the following two year price and LME inventory charts for Nickel:
See how the price and inventories increase and decrease more or less at the same time.
- Forums
- ASX - By Stock
- MRE
- nickel stocks at lme - one year low
nickel stocks at lme - one year low, page-16
Featured News
Add MRE (ASX) to my watchlist
 (20min delay) (20min delay)
|
|||||
|
Last
$1.99 |
Change
0.000(0.00%) |
Mkt cap ! $301.3M | |||
| Open | High | Low | Value | Volume |
| $1.99 | $1.99 | $1.98 | $912.8K | 460.8K |
Buyers (Bids)
| No. | Vol. | Price($) |
|---|---|---|
| 1 | 1750 | $1.98 |
Sellers (Offers)
| Price($) | Vol. | No. |
|---|---|---|
| $1.99 | 110666 | 6 |
View Market Depth
| No. | Vol. | Price($) |
|---|---|---|
| 1 | 1750 | 1.980 |
| 2 | 10000 | 1.975 |
| 9 | 120558 | 1.970 |
| 5 | 31339 | 1.965 |
| 1 | 7500 | 1.960 |
| Price($) | Vol. | No. |
|---|---|---|
| 1.990 | 110666 | 6 |
| 1.995 | 28403 | 2 |
| 2.000 | 198802 | 4 |
| 2.010 | 329322 | 4 |
| 2.020 | 495 | 1 |
| Last trade - 16.10pm 31/10/2024 (20 minute delay) ? |
Featured News
| MRE (ASX) Chart |
The Watchlist
BTH
BIGTINCAN HOLDINGS LIMITED
Harsh Shethia, Advisor
Harsh Shethia
Advisor
SPONSORED BY The Market Online


